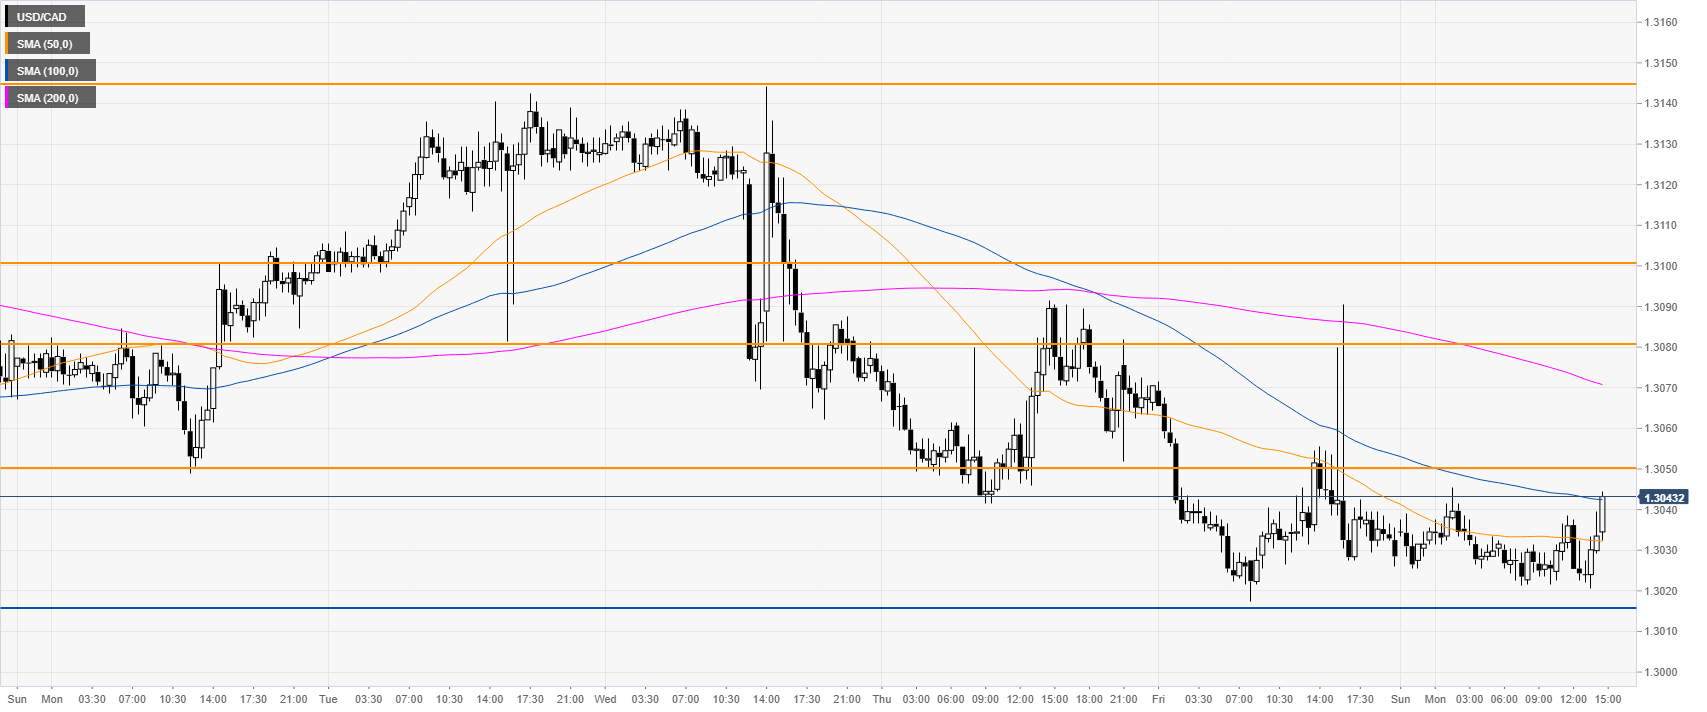
- USD/CAD is trading near daily highs near 1.3040.
- The levels to beat for bulls are 1.3050 and 1.3080/1.3100.
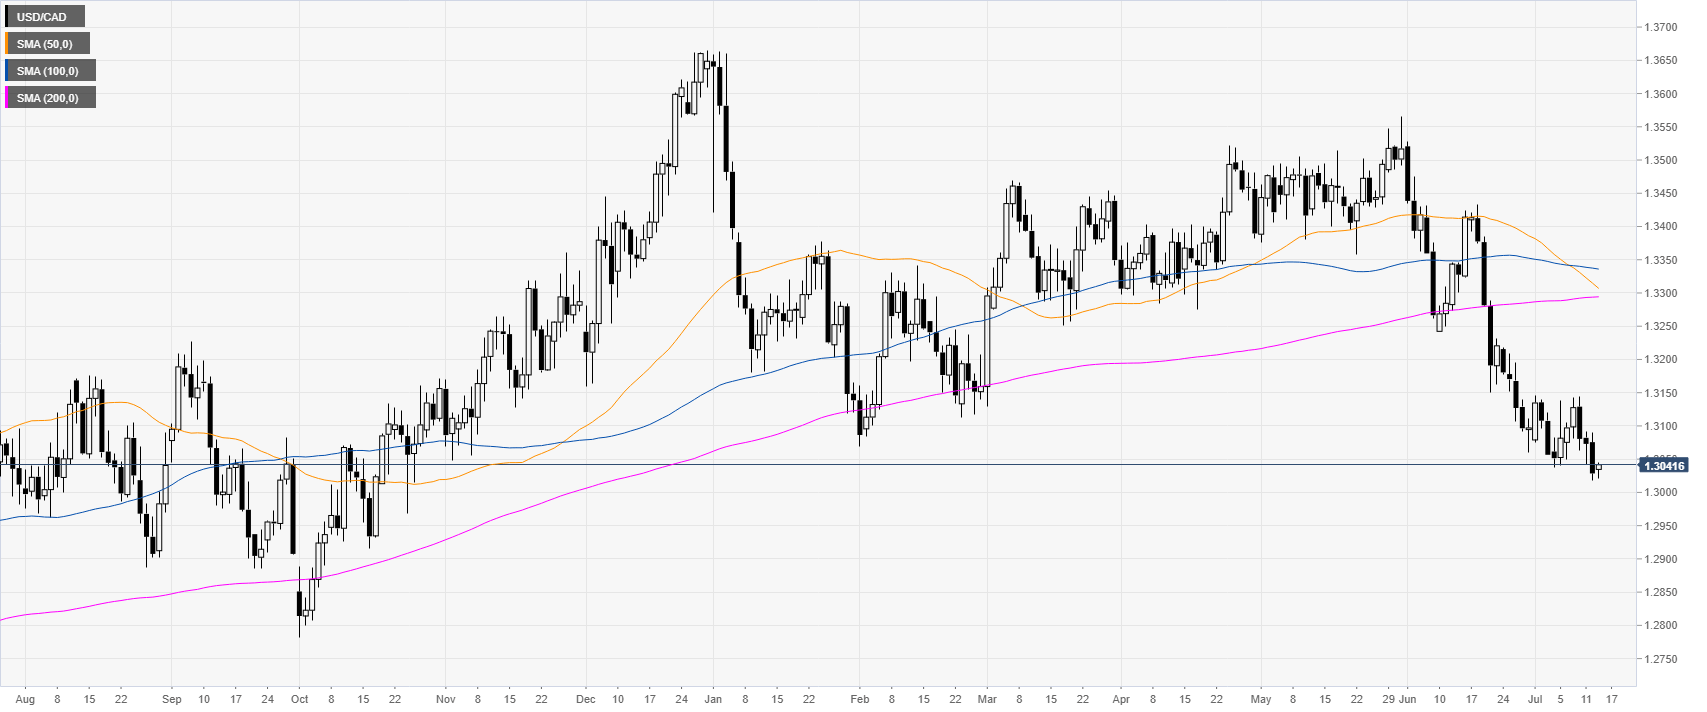
USD/CAD daily chart
USD/CAD is trading near multi-month lows as the market is trading below the main daily simple moving averages (DSMAs).
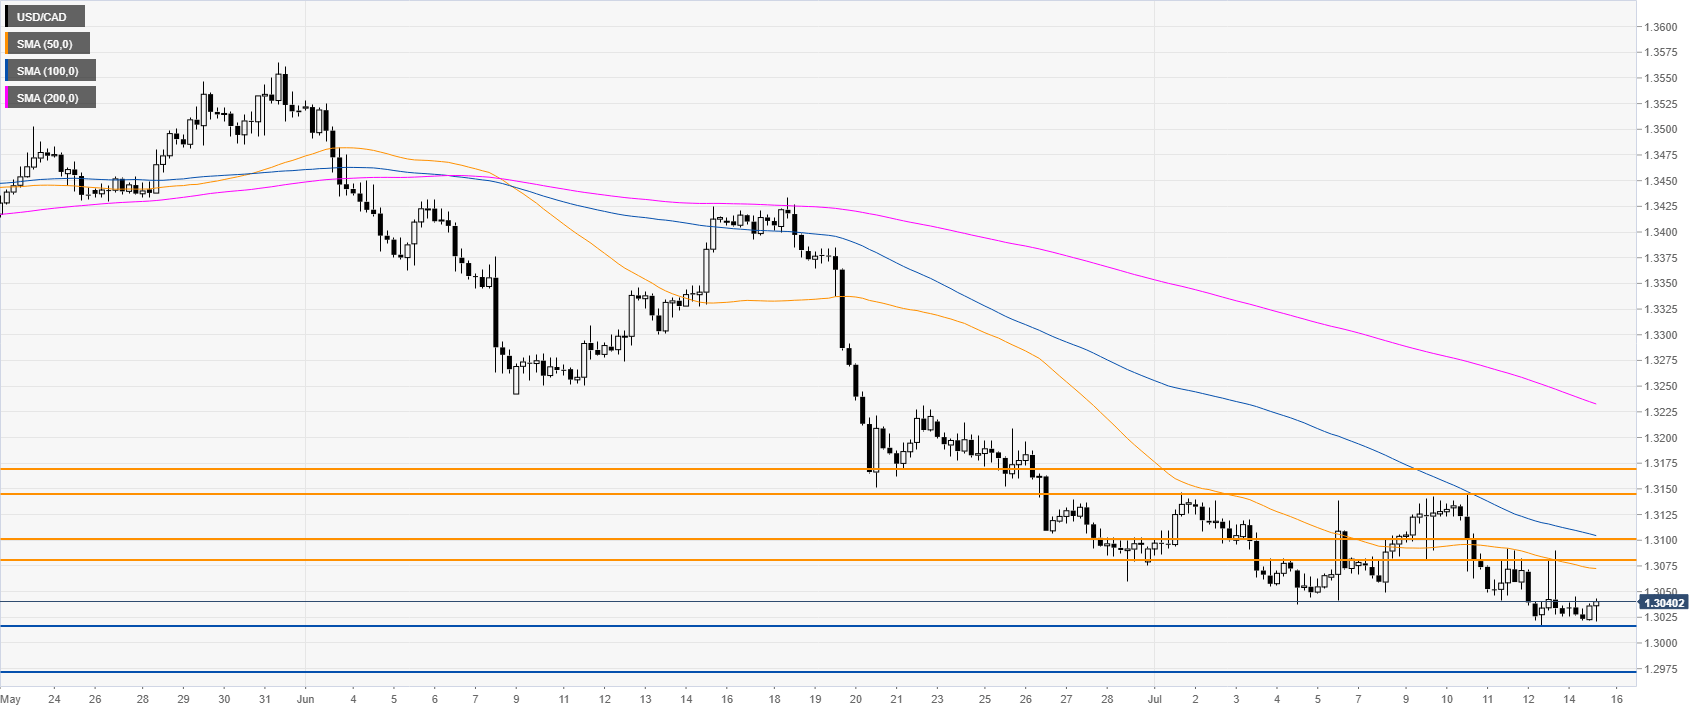
USD/CAD 4-hour chart
The market is trading just above 1.3016 support and below its main SMAs. Further down lies 1.2770, according to the Technical Confluences Indicator.
USD/CAD 30-minute chart
The market is challenging the daily as it is heading into stroong resistance near 1.3050 and the 100 SMA. If the bulls can overcome 1.3050, the next resistances can be seen near 1.3080, 1.3100 and 1.3150, according to the Technical Confluences Indicator.
Additional key levels
