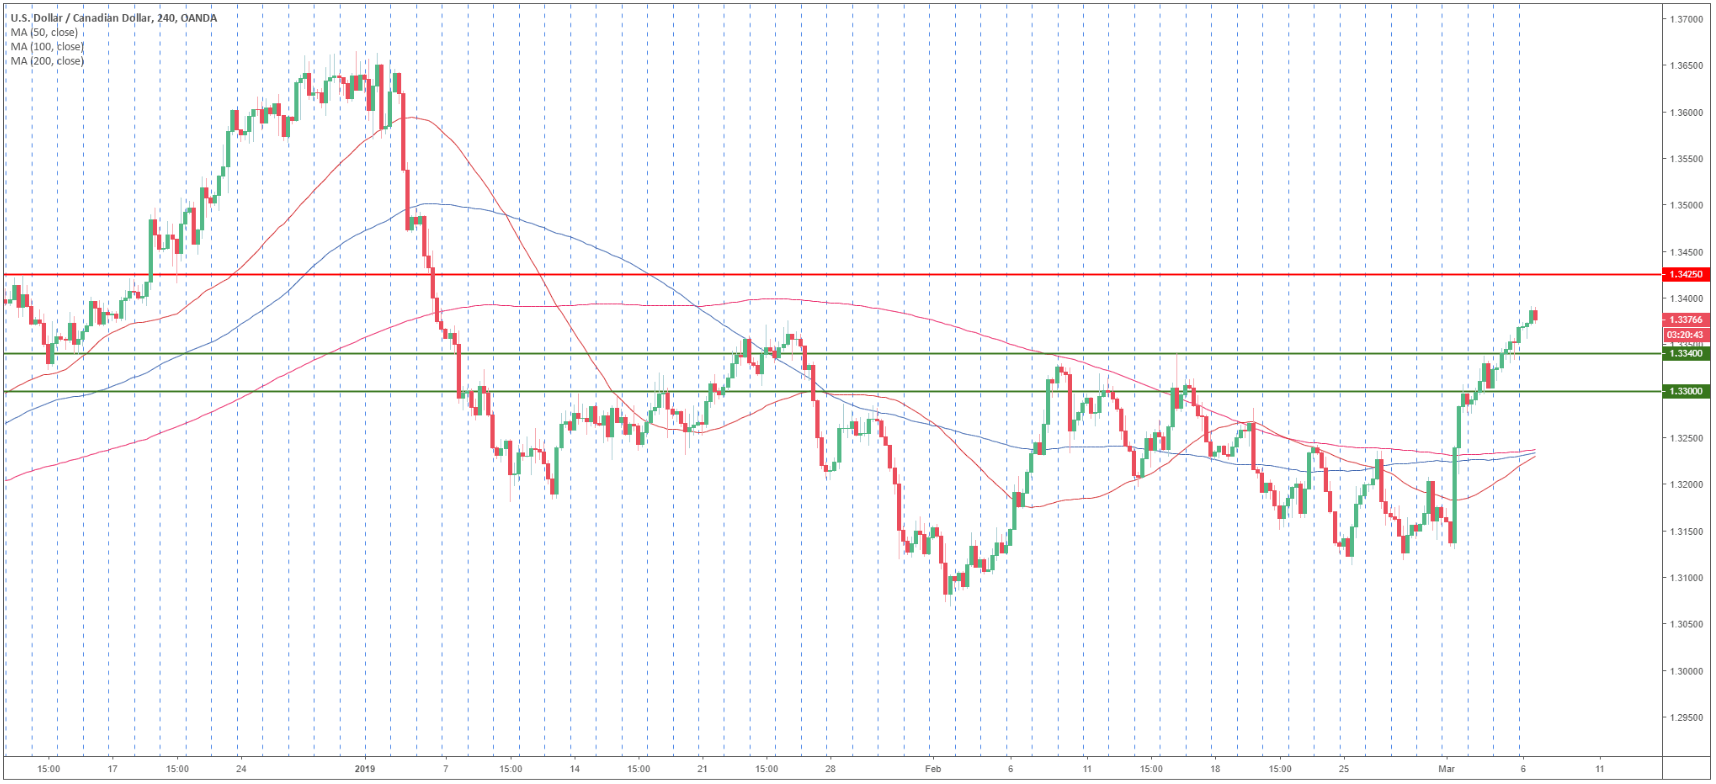
USD/CAD 4-hour chart
- USD/CAD is trading above its main SMAs suggesting bullish momentum in the near-term.
- The Bank Of Canada rate statement will be announced at 15:00 GMT and can provide volatility to CAD-related pairs.
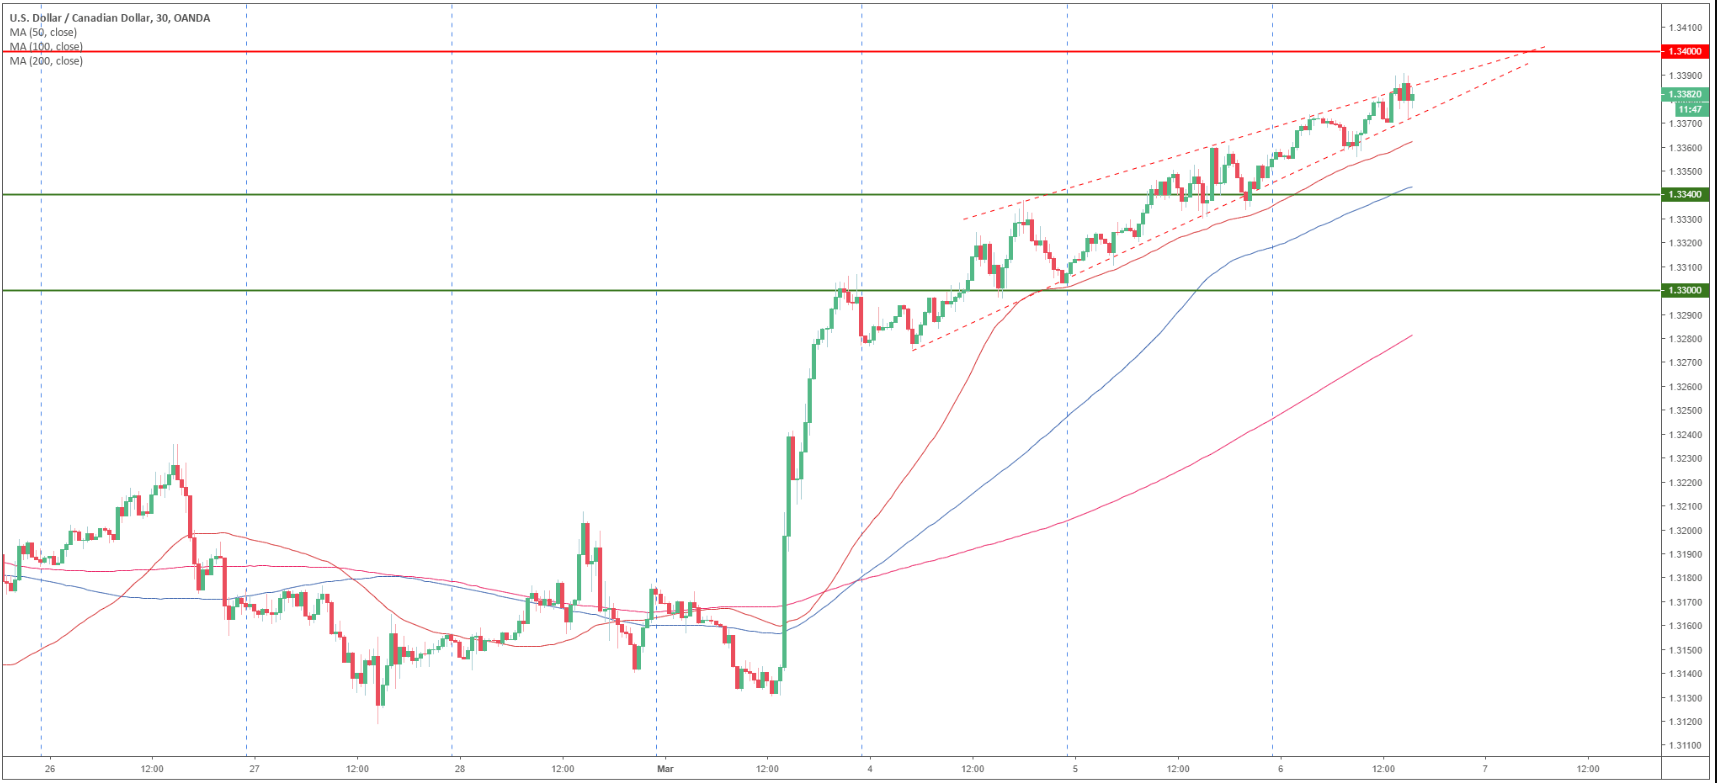
USD/CAD 30-minute chart
- USD/CAD has been evolving in a rising wedge suggesting that the market is running out of steam.
- Bears can target 1.3340 and 1.3300 to the downside.
- On the flip side, if bulls break above 1.3400 all bets are off and the market could skyrocket towards 1.3425 level.
Additional key levels
USD/CAD
Overview:
Today Last Price: 1.3382
Today Daily change: 30 pips
Today Daily change %: 0.22%
Today Daily Open: 1.3352
Trends:
Daily SMA20: 1.3236
Daily SMA50: 1.3294
Daily SMA100: 1.3278
Daily SMA200: 1.317
Levels:
Previous Daily High: 1.3362
Previous Daily Low: 1.3302
Previous Weekly High: 1.3308
Previous Weekly Low: 1.3112
Previous Monthly High: 1.3341
Previous Monthly Low: 1.3069
Daily Fibonacci 38.2%: 1.3339
Daily Fibonacci 61.8%: 1.3324
Daily Pivot Point S1: 1.3315
Daily Pivot Point S2: 1.3278
Daily Pivot Point S3: 1.3255
Daily Pivot Point R1: 1.3375
Daily Pivot Point R2: 1.3398
Daily Pivot Point R3: 1.3435
