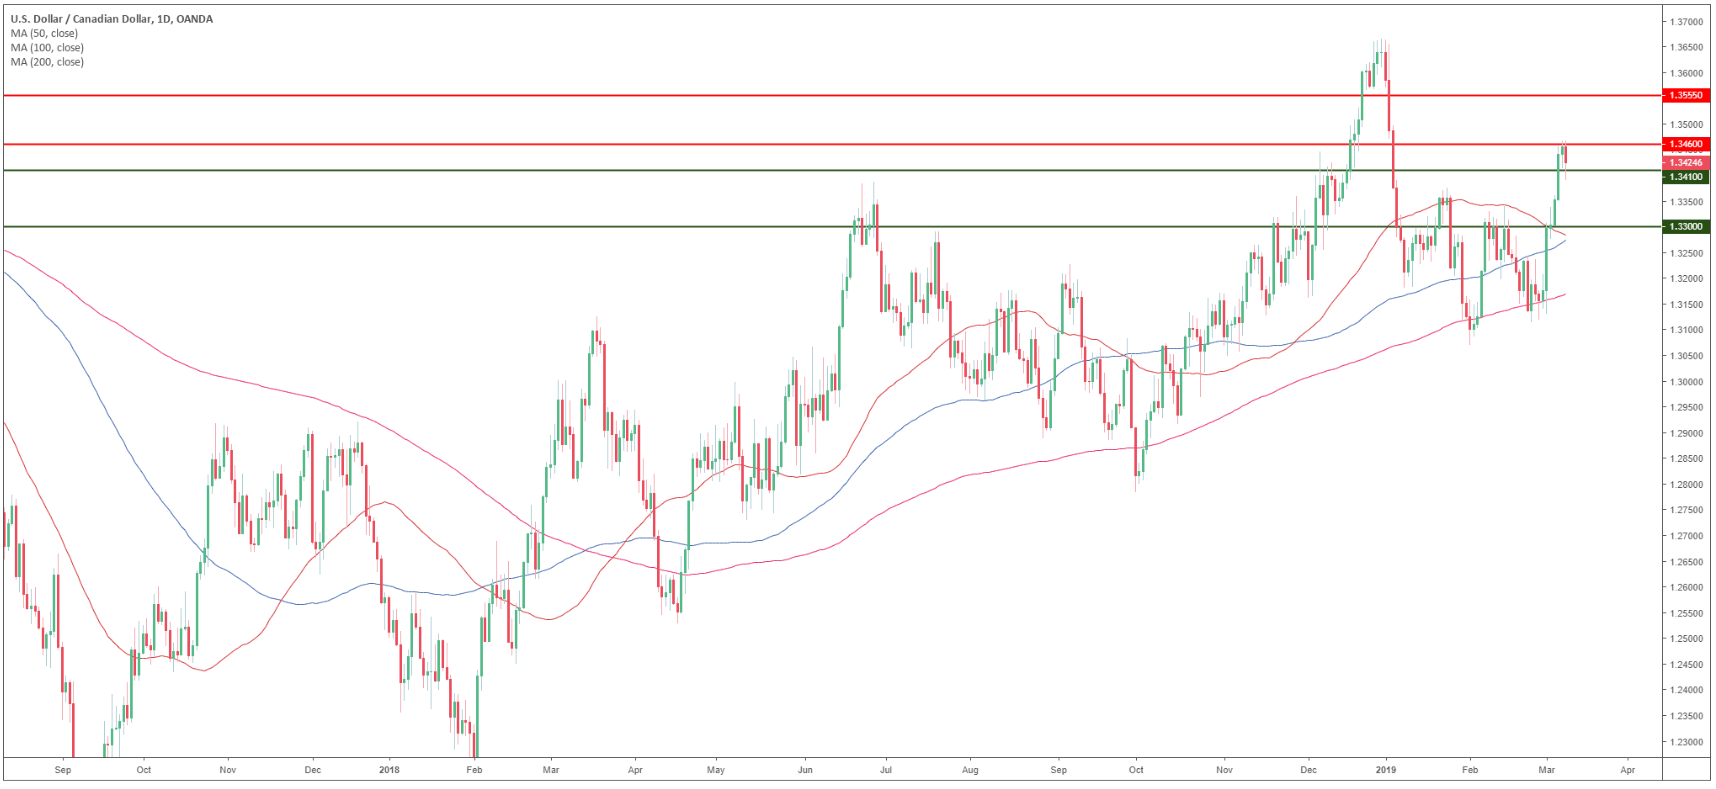
USD/CAD daily chart
- USD/CAD is in a bull trend above its main simple moving averages (SMAs).
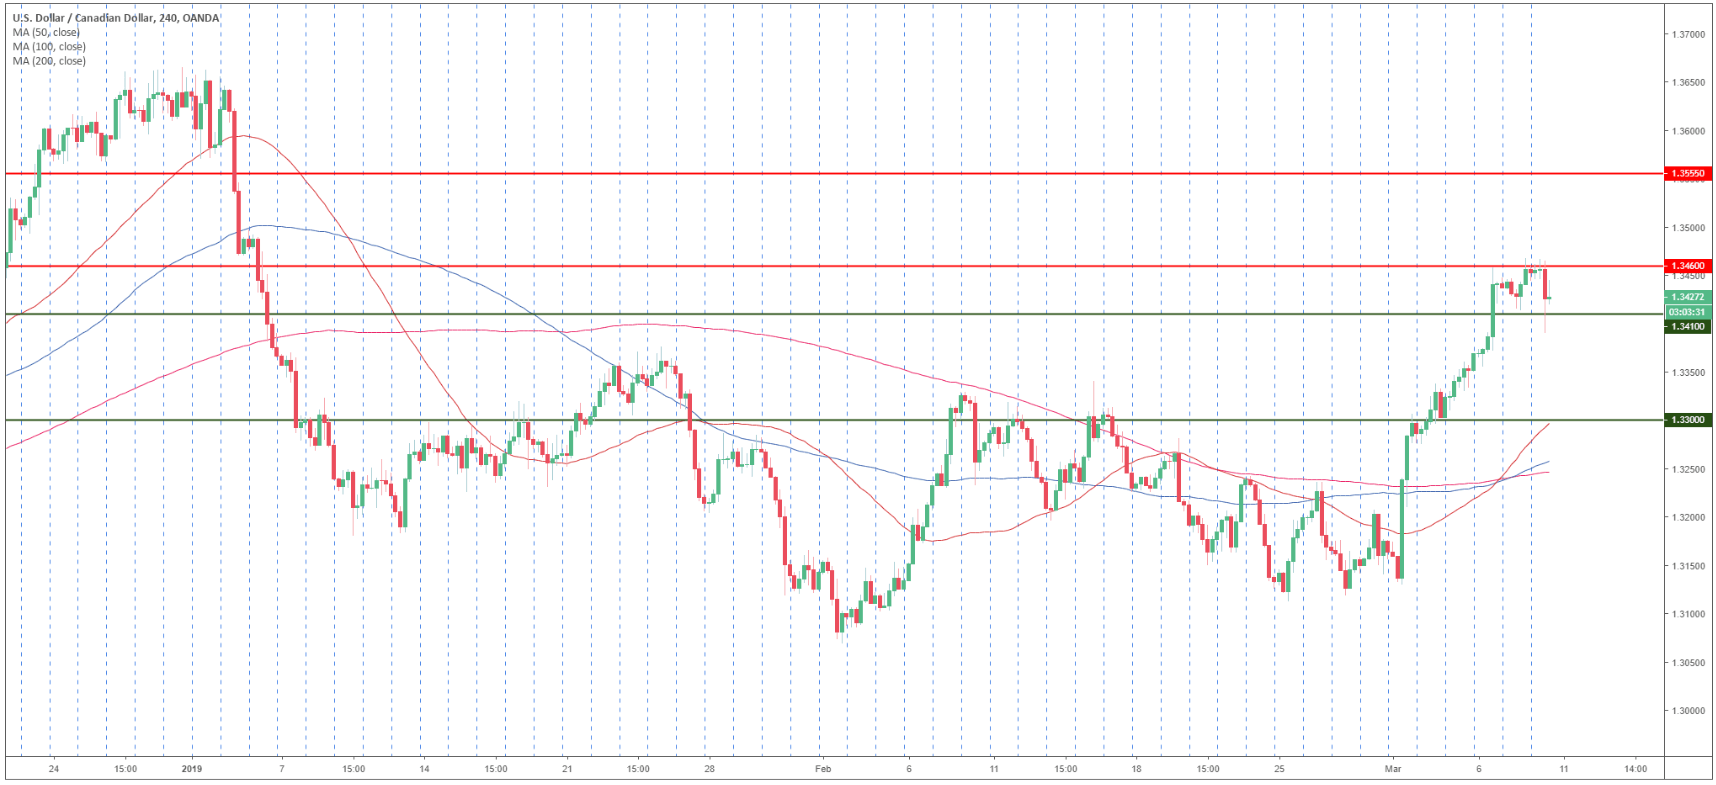
USD/CAD 4-hour chart
- USD/CAD is evolving above its main SMAs suggesting a bullish bias in the medium-term.
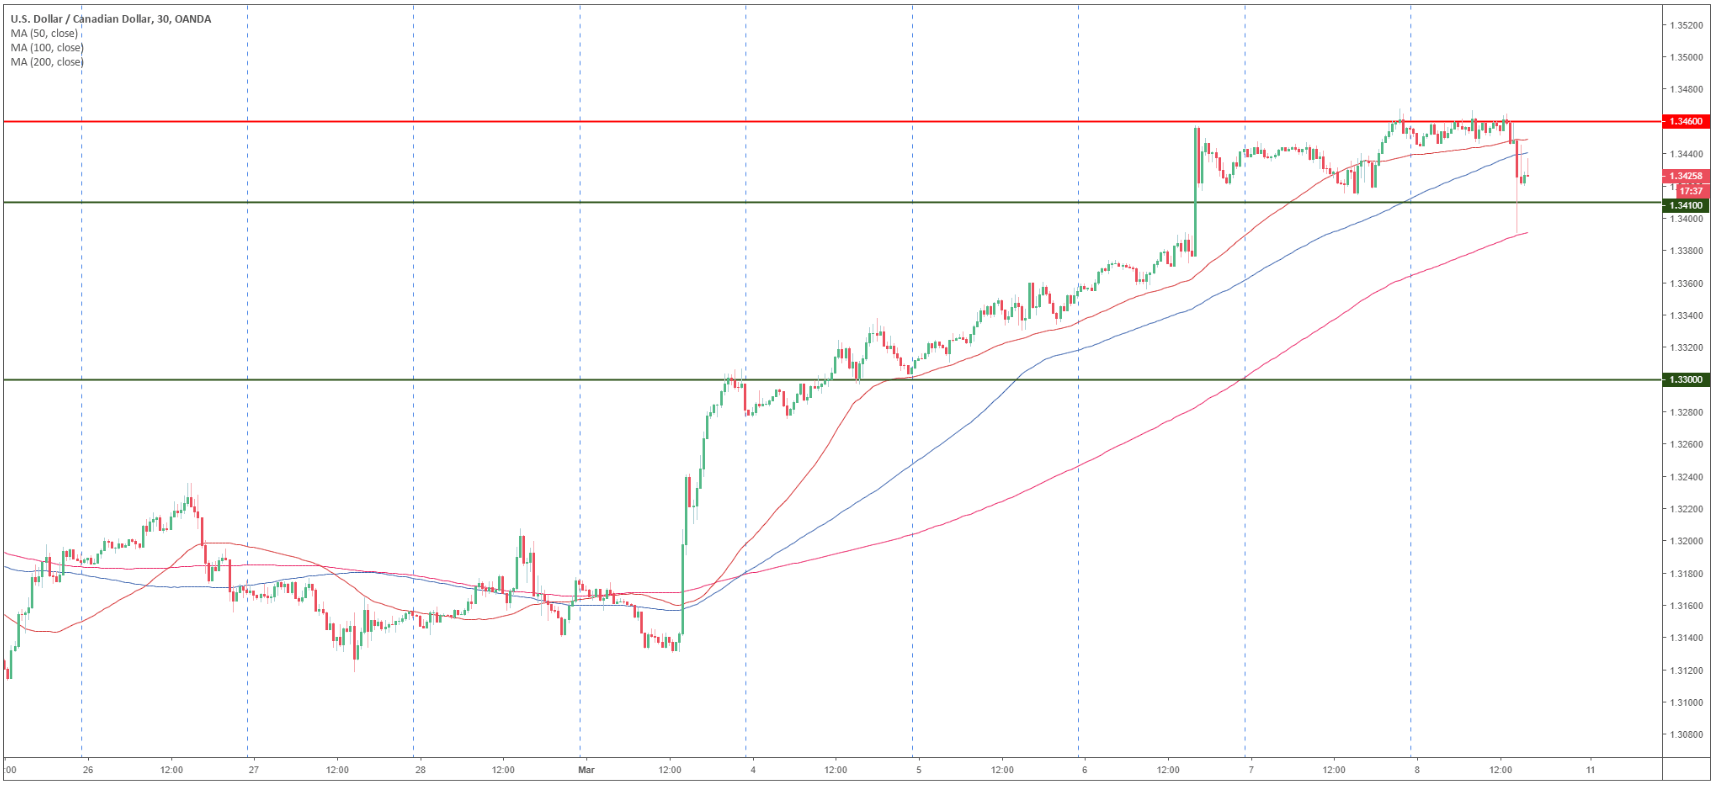
USD/CAD 30-minute chart
- USD/CAD is trading below the 50 and 100 SMAs suggesting a consolidation phase.
- Resistances to the upside are seen at 1.3460 and 1.3555 level.
- On the way down, supports are at 1.3410 and 1.3300 support.
Additional key levels
USD/CAD
Overview:
Today Last Price: 1.3426
Today Daily change: -35 pips
Today Daily change %: -0.26%
Today Daily Open: 1.3461
Trends:
Daily SMA20: 1.3256
Daily SMA50: 1.3288
Daily SMA100: 1.3286
Daily SMA200: 1.3175
Levels:
Previous Daily High: 1.3469
Previous Daily Low: 1.3414
Previous Weekly High: 1.3308
Previous Weekly Low: 1.3112
Previous Monthly High: 1.3341
Previous Monthly Low: 1.3069
Daily Fibonacci 38.2%: 1.3447
Daily Fibonacci 61.8%: 1.3435
Daily Pivot Point S1: 1.3427
Daily Pivot Point S2: 1.3393
Daily Pivot Point S3: 1.3372
Daily Pivot Point R1: 1.3482
Daily Pivot Point R2: 1.3503
Daily Pivot Point R3: 1.3537
