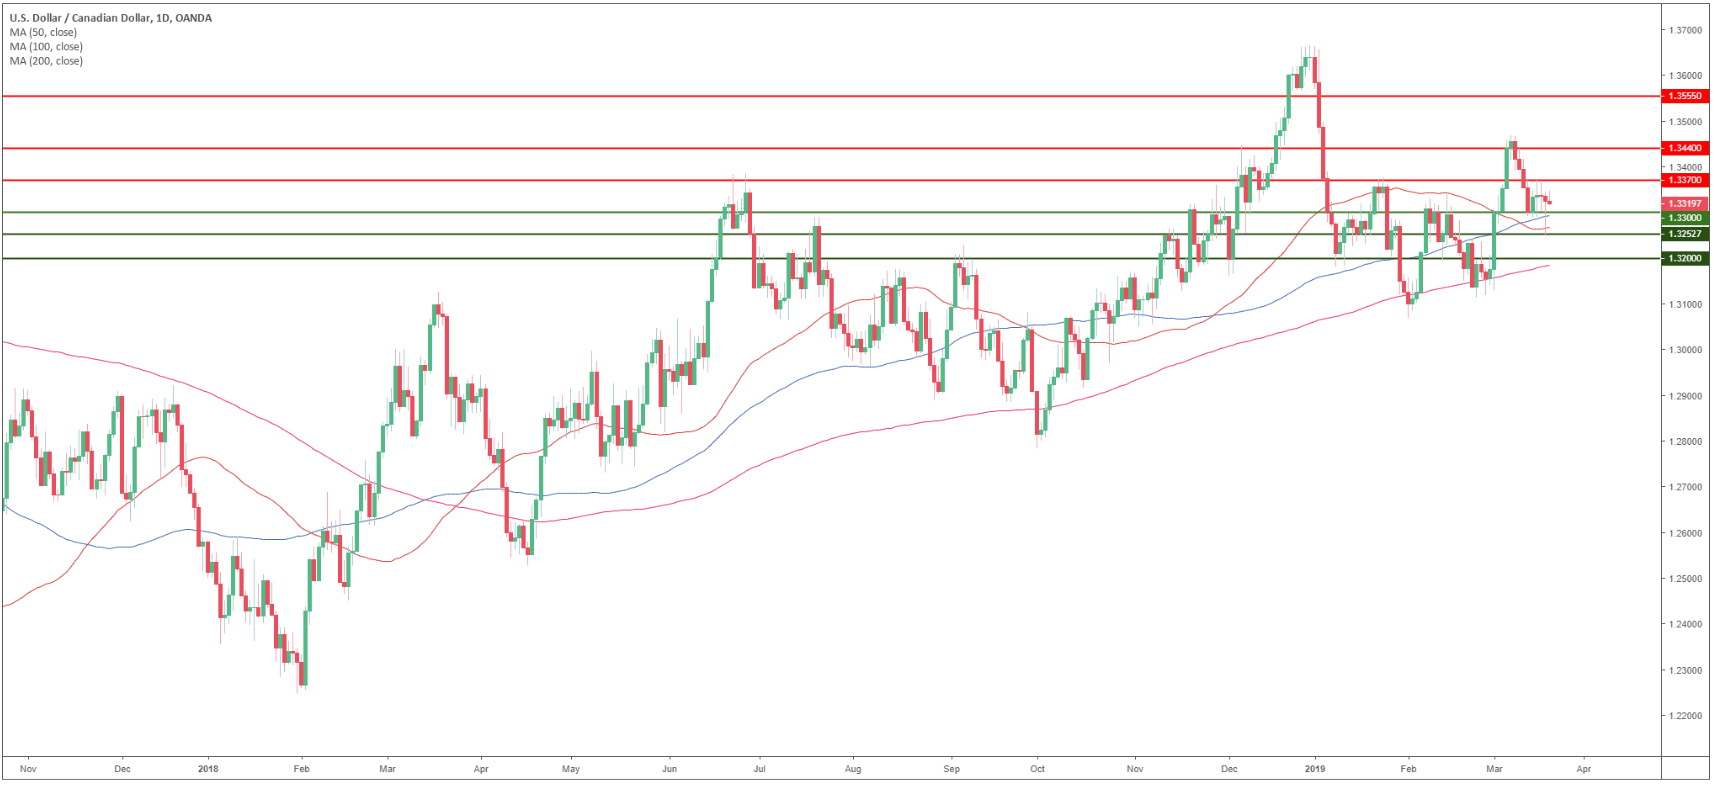
USD/CAD daily chart
- USD/CAD is trading in a bull trend above the 200-day simple moving averages (SMA).
- The FOMC at 18.00 GMT can lead to high volatility.
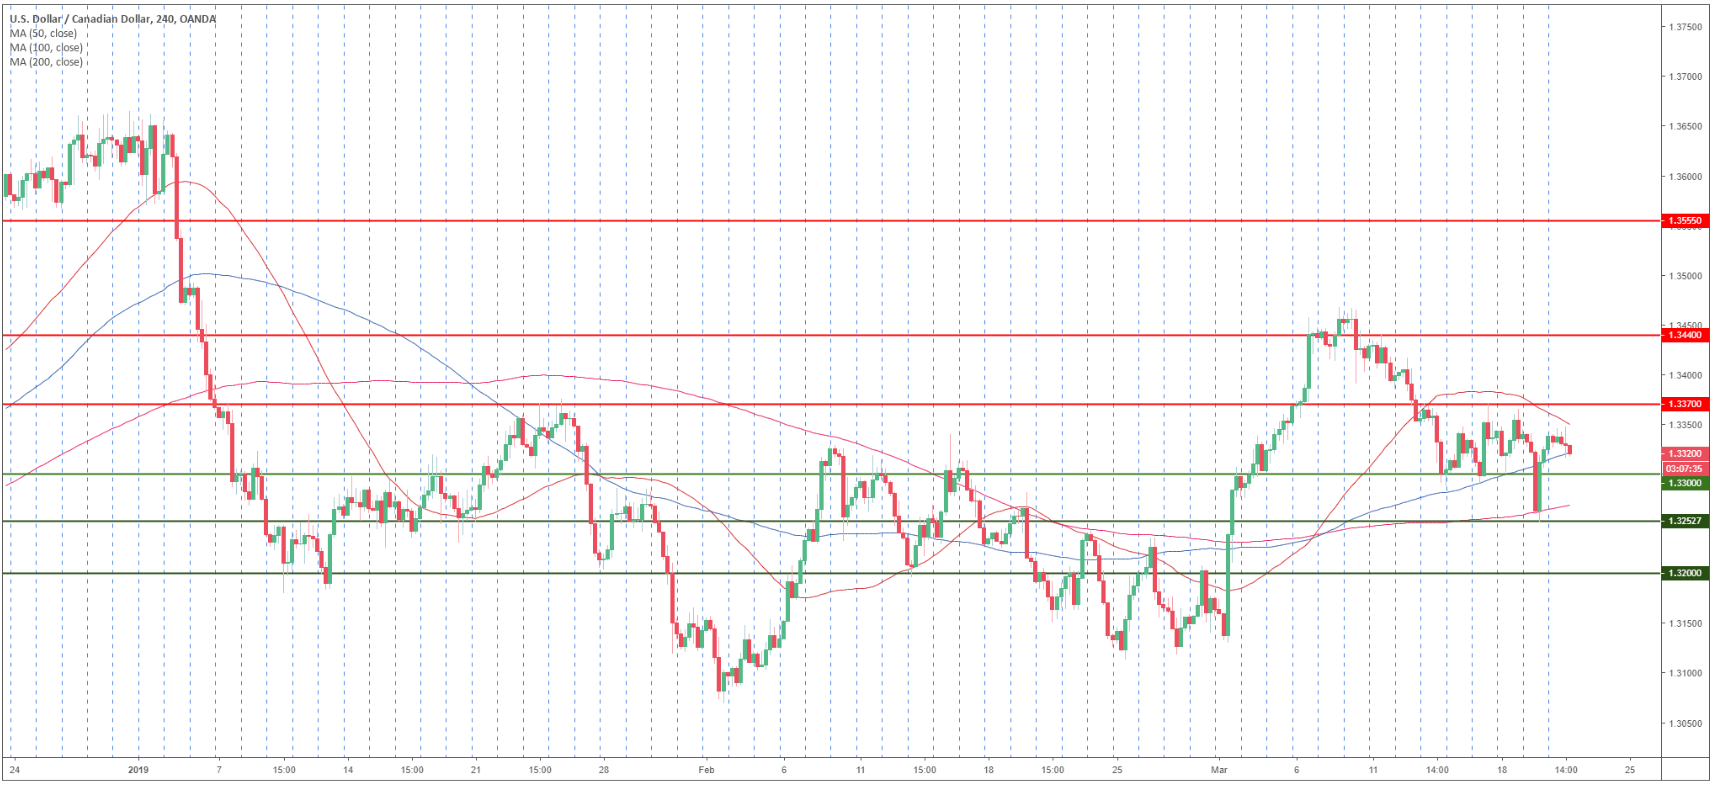
USD/CAD 4-hour chart
- USD/CAD is trading between the 100 and 200 SMAs suggesting a consolidation in the medium-term.
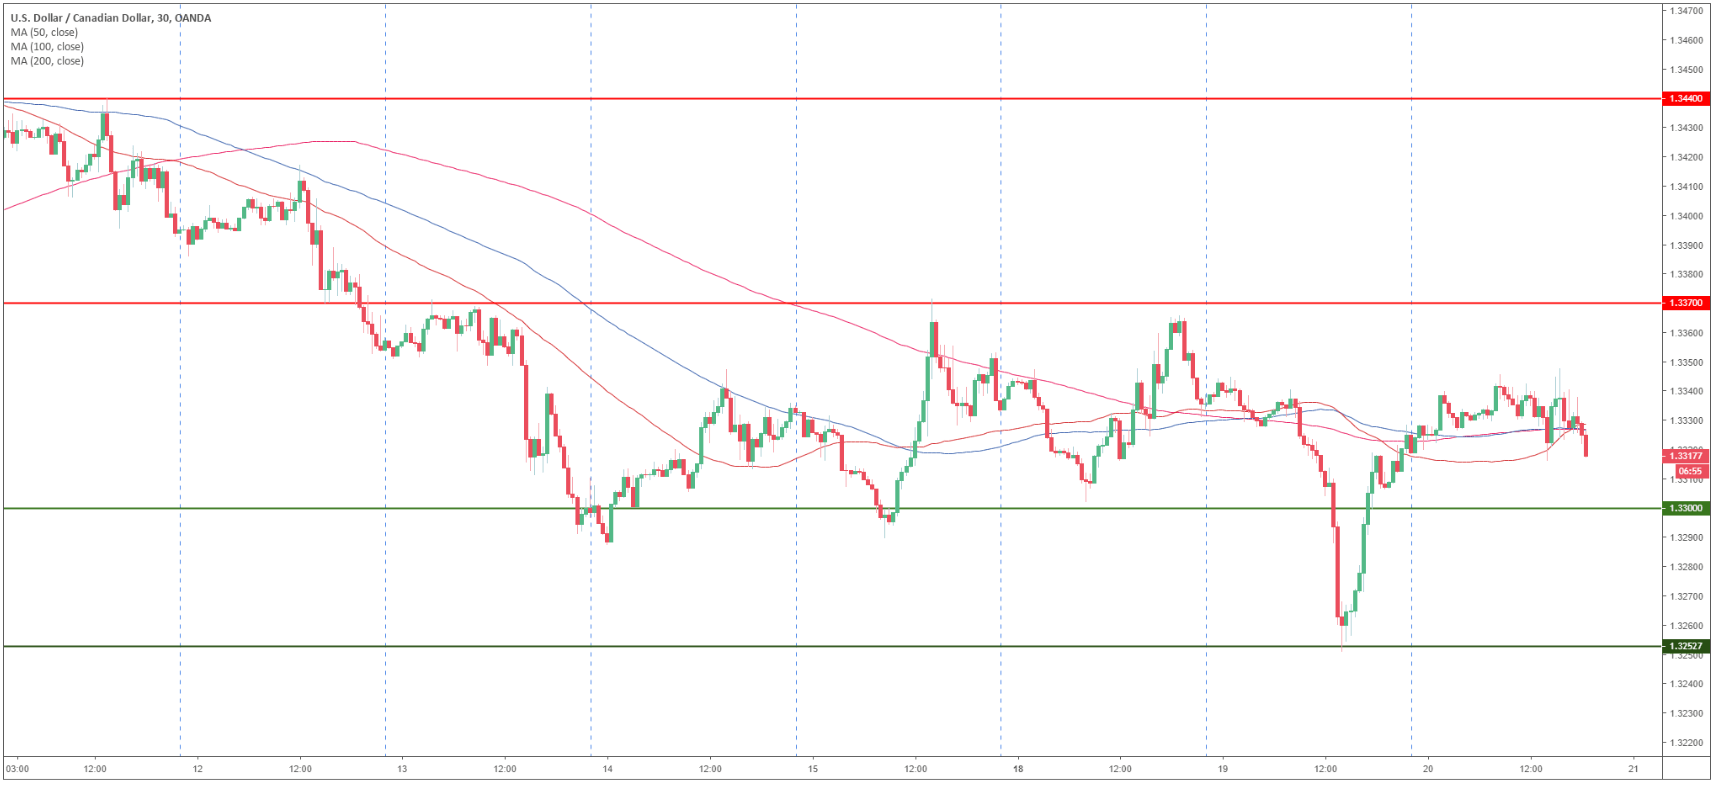
USD/CAD 30-minute chart
- USD/CAD is trading below its main SMAs suggesting bearish momentum in the short-term.
- USD/CAD is declining towards 1.3300 figure. The next support is seen at 1.3252 level.
- Resistances are at 1.3370 and 1.3440 level.
Additional key levels
