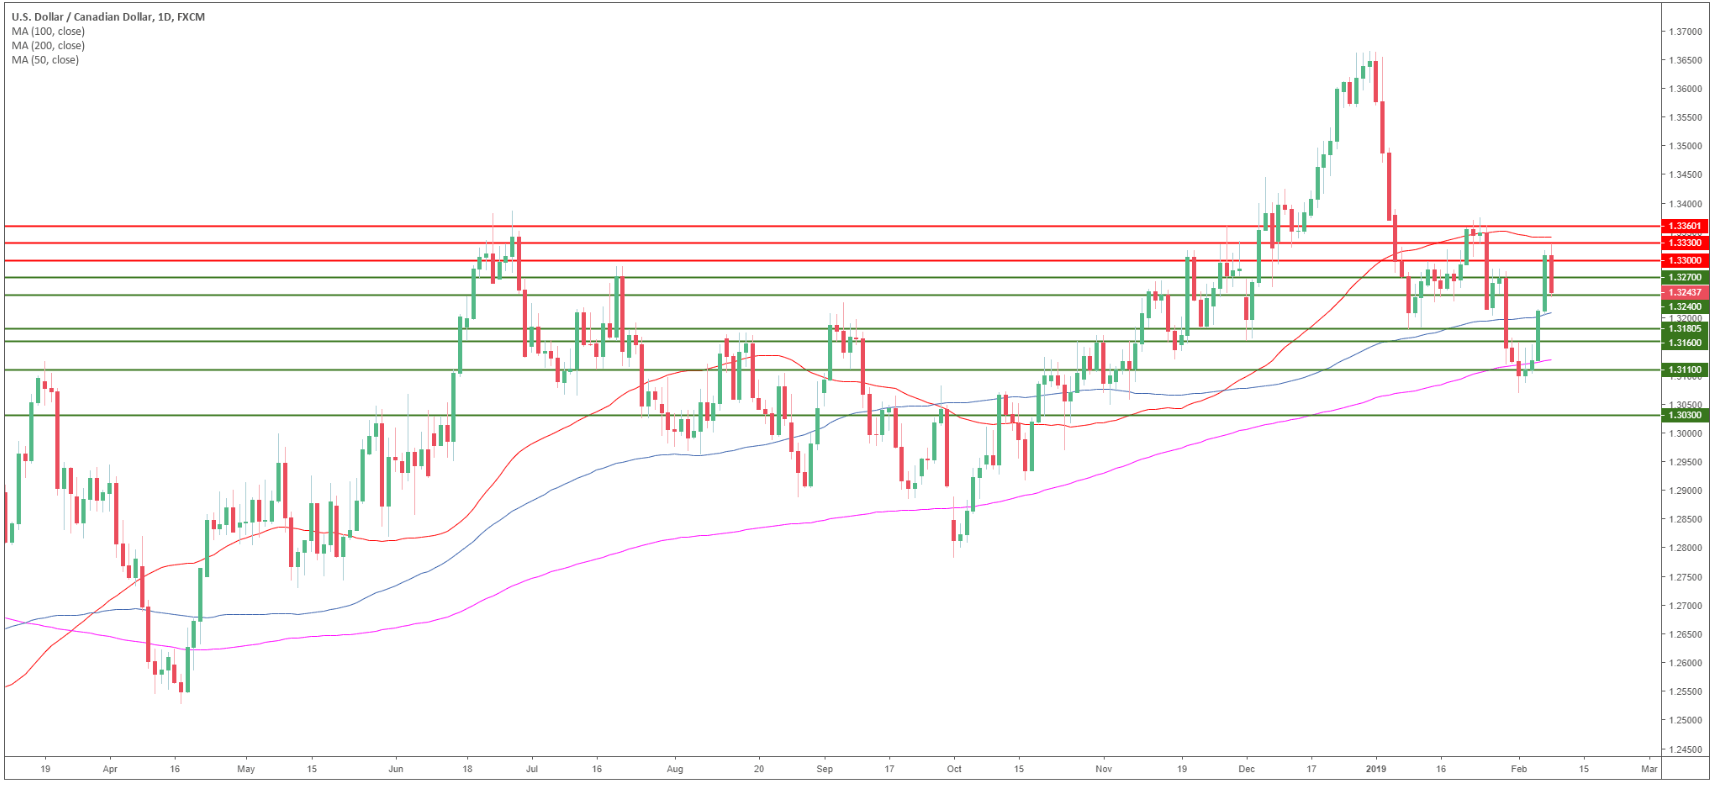
USD/CAD daily chart
- USD/CAD is trading in a bull trend above the 200-day simple moving average (SMA).
- In Canada, Net Change in Employment rose to 66.8K versus 8K expected in January, sending the CAD up.
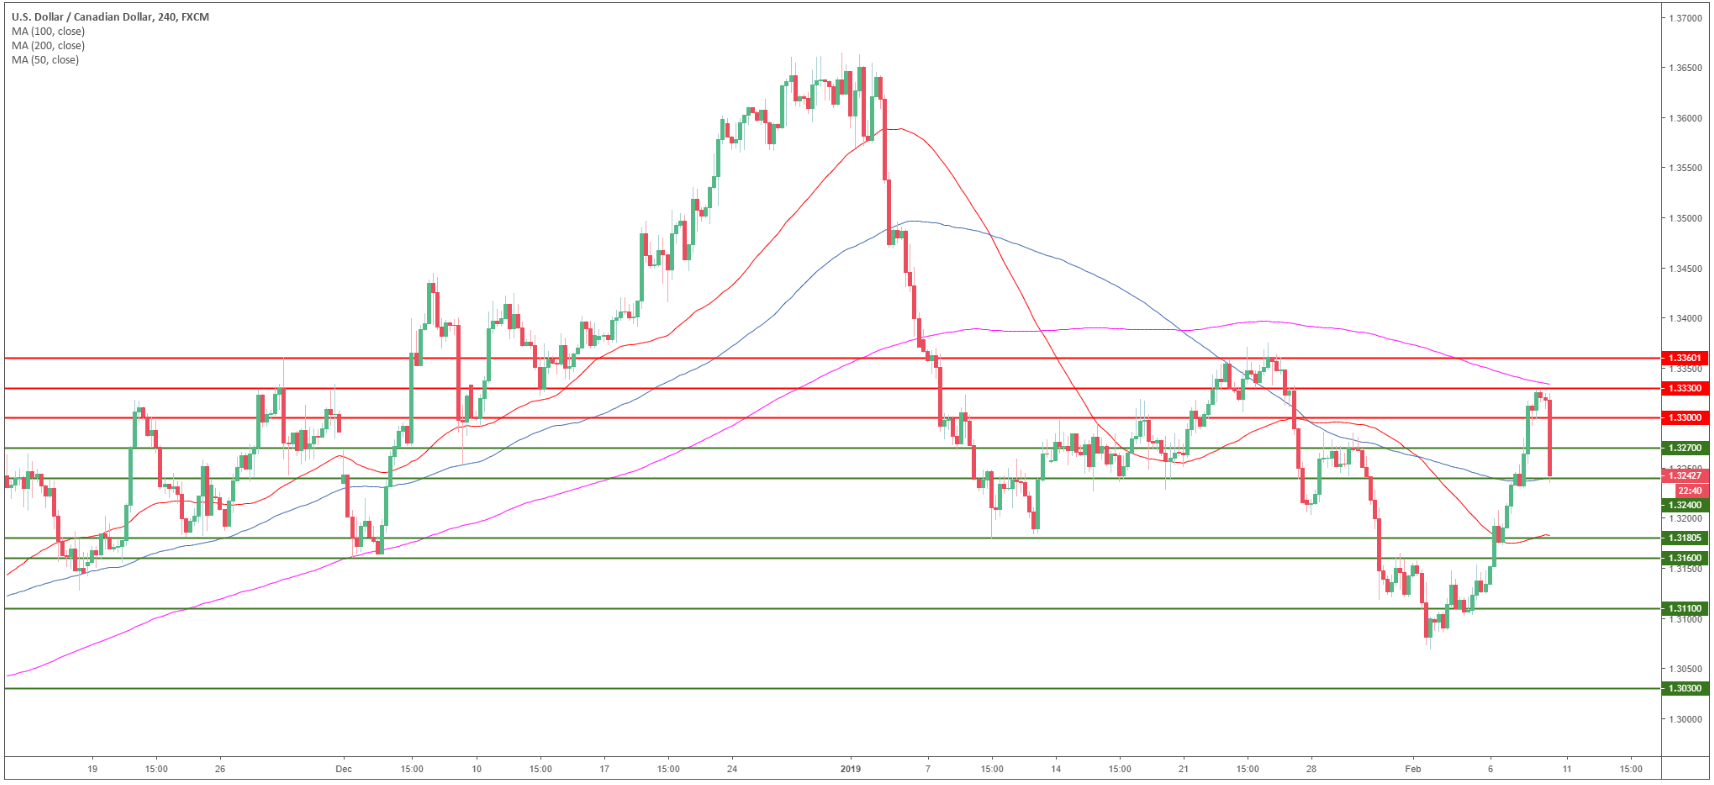
USD/CAD 4-hour chart
- USD/CAD is trading between the 100 and 200 SMAs suggesting sideways trading in the medium-term.
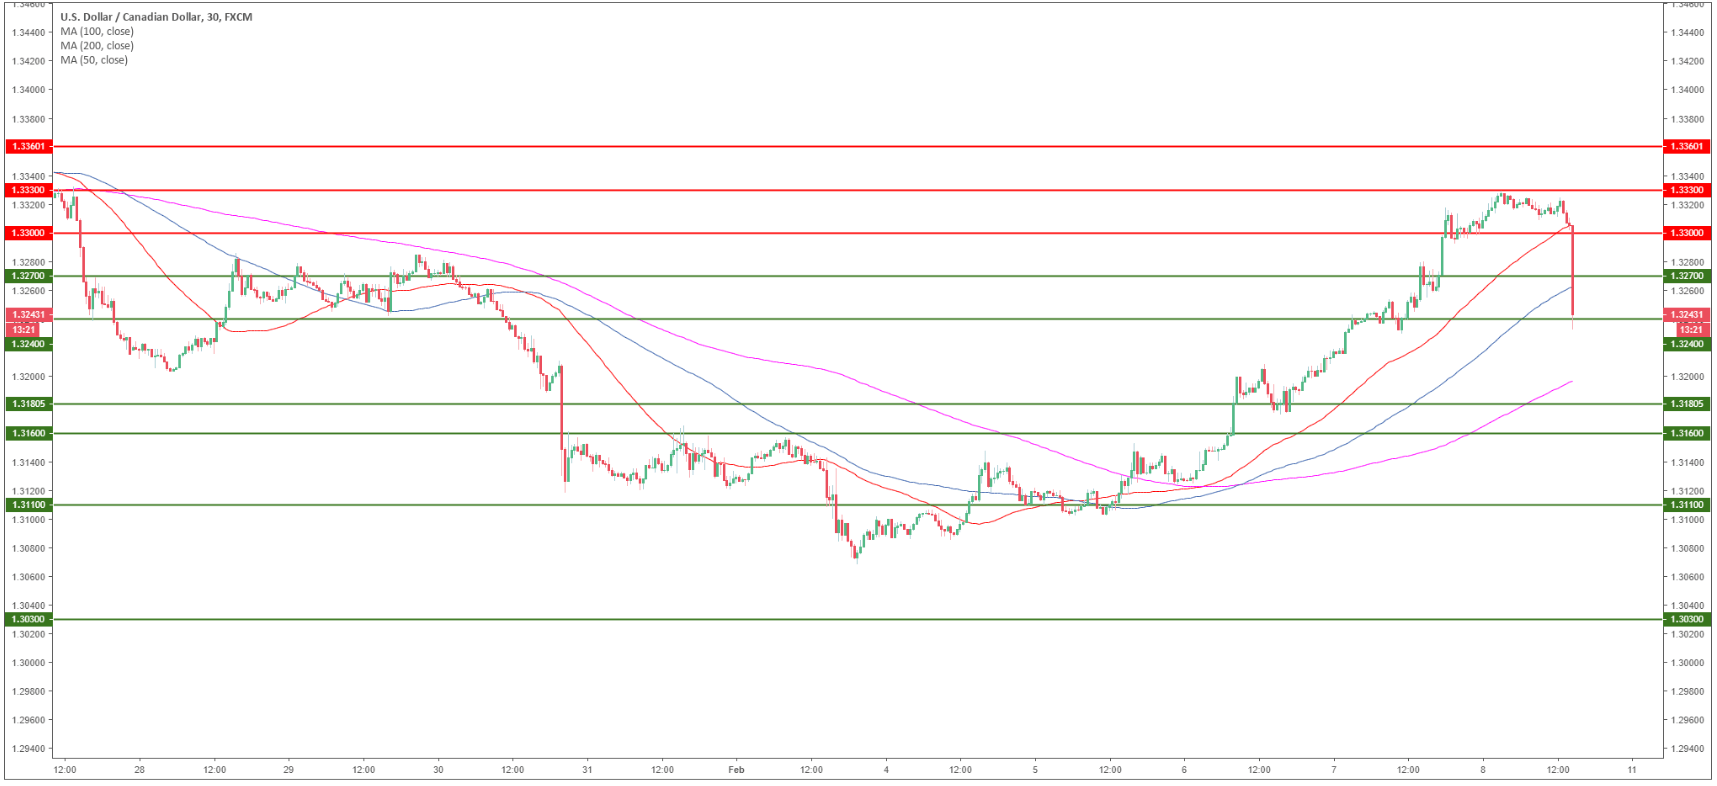
USD/CAD 30-minute chart
- USD/CAD is trading below its main 50 and 100 SMAs suggesting a slow down in the bullish momentum.
- Big bears came in the market and the drop is likely to extend to 1.3105 to the downside.
- Resistance is seen at 1.3270 and 1.3300 figure.
Additional key levels
USD/CAD
Overview:
Today Last Price: 1.3242
Today Daily change: -58 pips
Today Daily change %: -0.44%
Today Daily Open: 1.33
Trends:
Daily SMA20: 1.3243
Daily SMA50: 1.3367
Daily SMA100: 1.3227
Daily SMA200: 1.3136
Levels:
Previous Daily High: 1.3318
Previous Daily Low: 1.3202
Previous Weekly High: 1.3287
Previous Weekly Low: 1.3069
Previous Monthly High: 1.3664
Previous Monthly Low: 1.3118
Daily Fibonacci 38.2%: 1.3274
Daily Fibonacci 61.8%: 1.3246
Daily Pivot Point S1: 1.3228
Daily Pivot Point S2: 1.3156
Daily Pivot Point S3: 1.3111
Daily Pivot Point R1: 1.3345
Daily Pivot Point R2: 1.339
Daily Pivot Point R3: 1.3462
