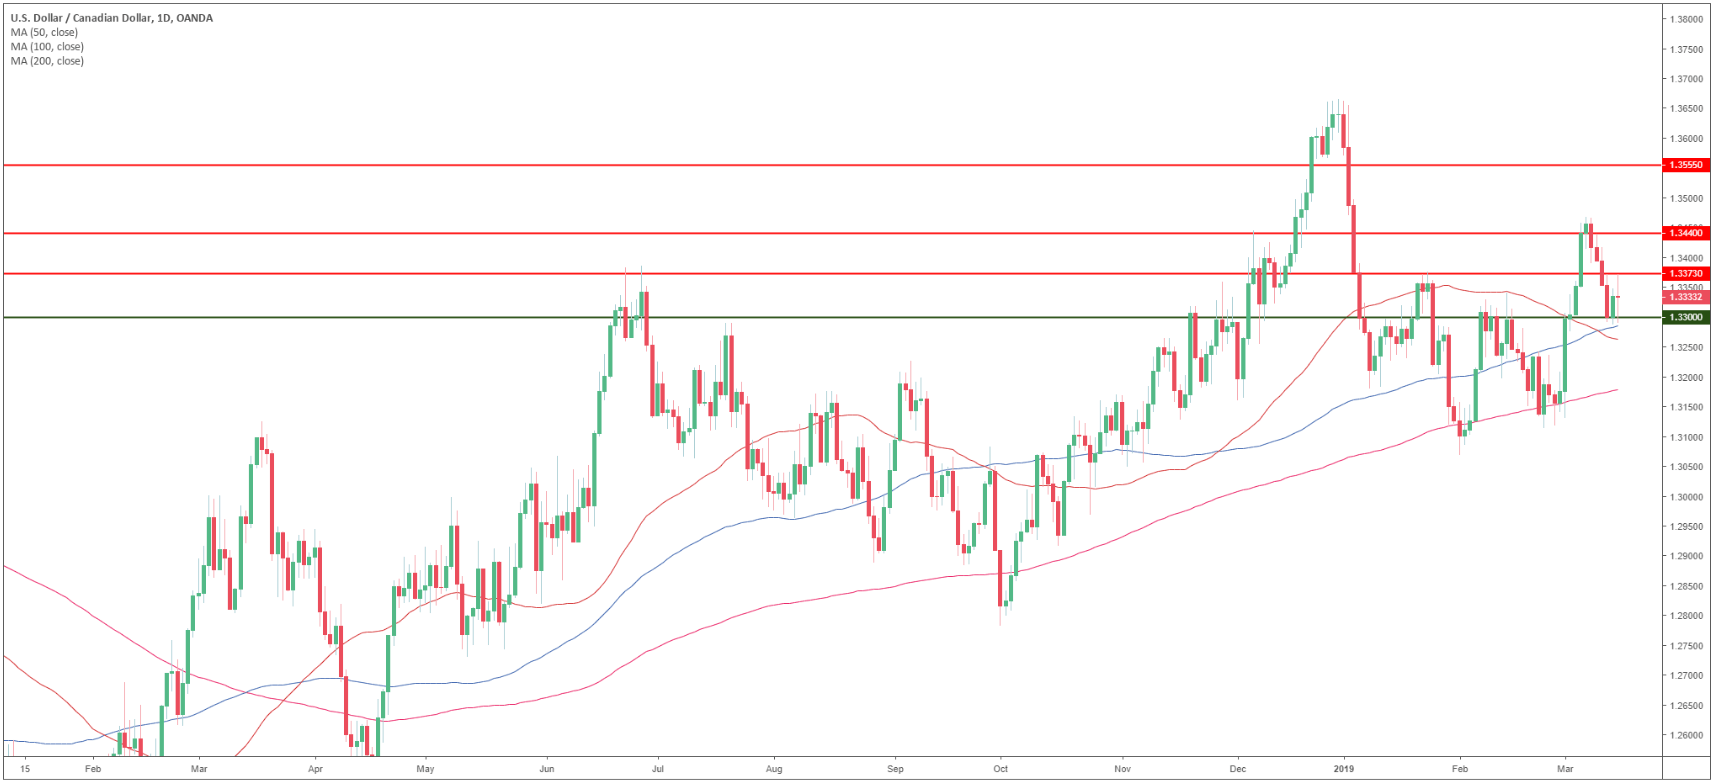
USD/CAD daily chart
- USD/CAD is trading in a bull trend above its main simple moving averages (SMAs).
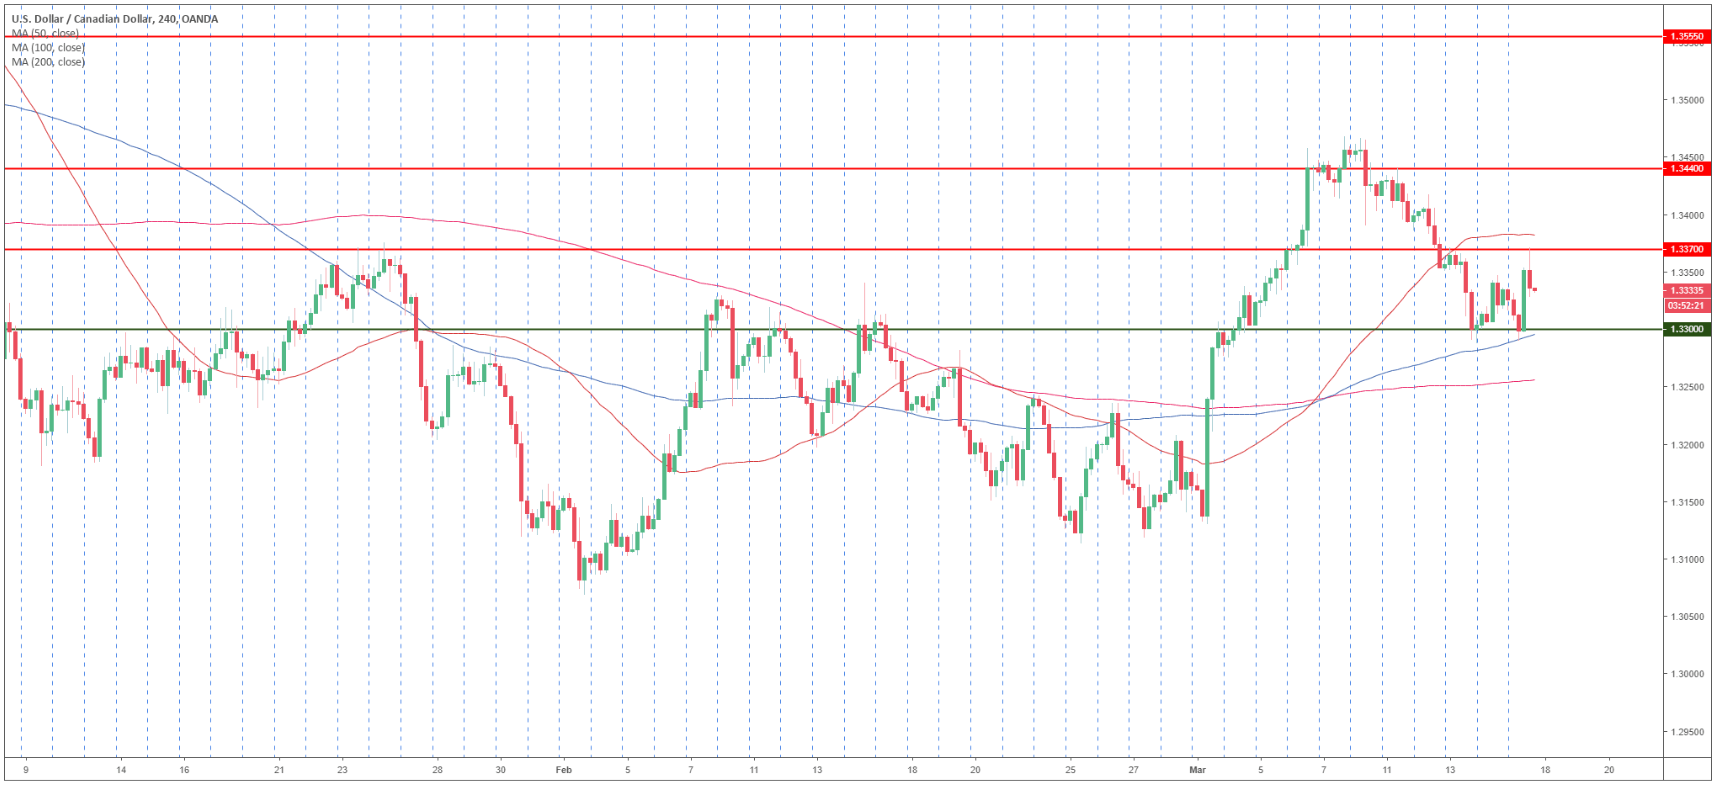
USD/CAD 4-hour chart
- USD/CAD is trading between the 50 and 100 SMAs suggesting a consolidation in the medium-term.
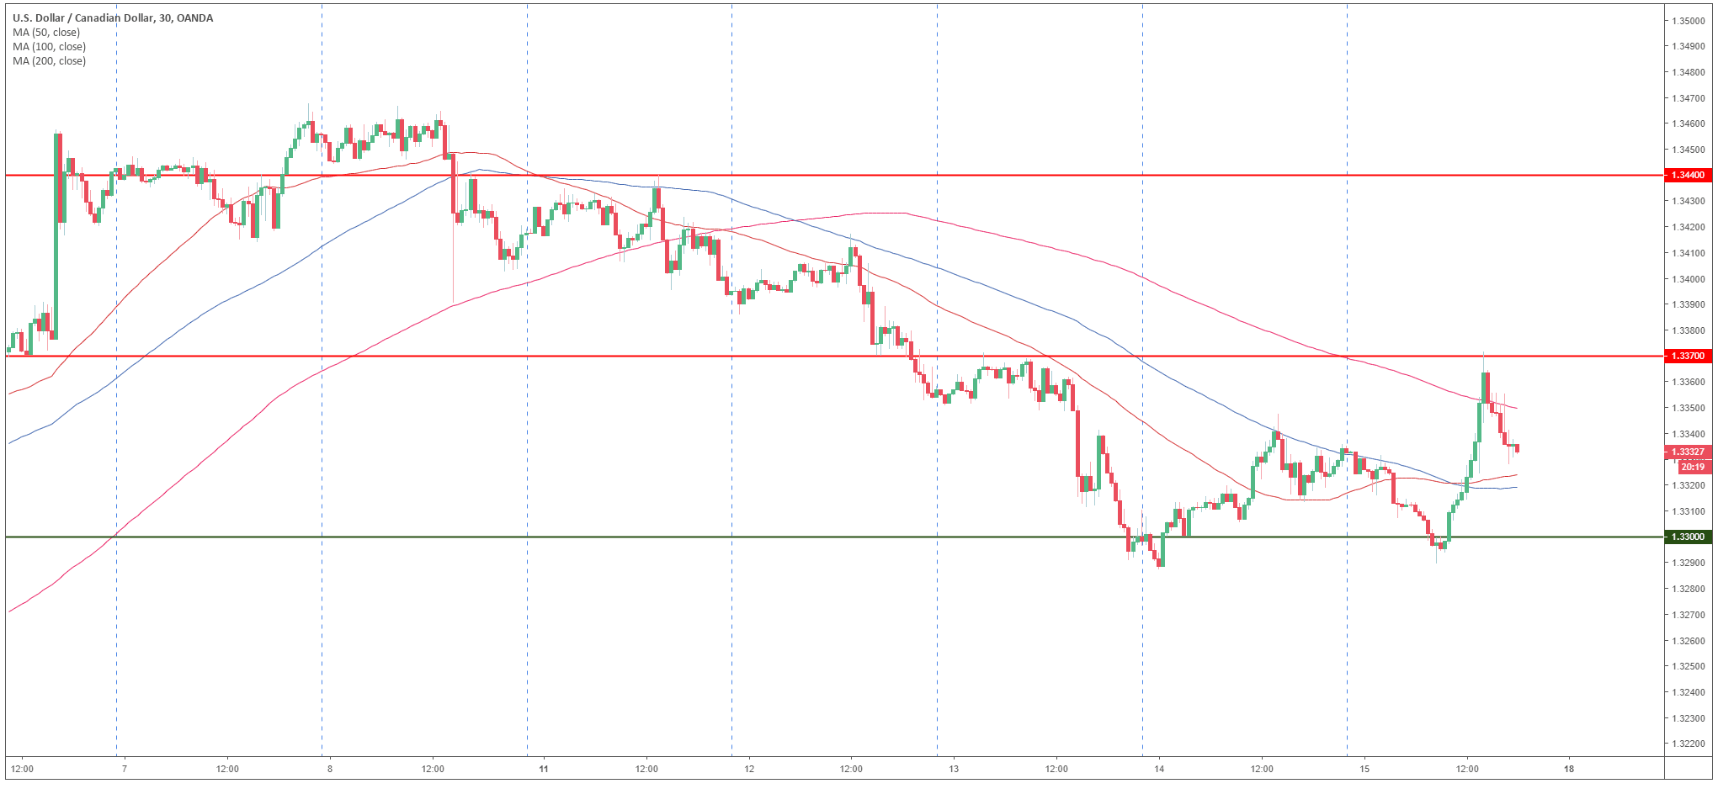
USD/CAD 30-minute chart
- USD/CAD is trading above the 1.3300 figure and its 50 and 100 SMAs suggesting bullish momentum in the short-term.
- A break above 1.3370 can lead to 1.3440 resistance.
- Support is at the 1.3300 figure.
Additional key levels
USD/CAD
Overview:
Today Last Price: 1.3336
Today Daily change: 2 pips
Today Daily change %: 0.01%
Today Daily Open: 1.3334
Trends:
Daily SMA20: 1.3278
Daily SMA50: 1.3264
Daily SMA100: 1.33
Daily SMA200: 1.3185
Levels:
Previous Daily High: 1.3349
Previous Daily Low: 1.3287
Previous Weekly High: 1.3469
Previous Weekly Low: 1.3275
Previous Monthly High: 1.3341
Previous Monthly Low: 1.3069
Daily Fibonacci 38.2%: 1.3325
Daily Fibonacci 61.8%: 1.331
Daily Pivot Point S1: 1.3298
Daily Pivot Point S2: 1.3261
Daily Pivot Point S3: 1.3236
Daily Pivot Point R1: 1.336
Daily Pivot Point R2: 1.3385
Daily Pivot Point R3: 1.3422
