- USD/CAD is trading close to multi-month lows.
- On a recovery scenario, the levels to beat for bulls are at 1.3050 and 1.3080/1.3100.
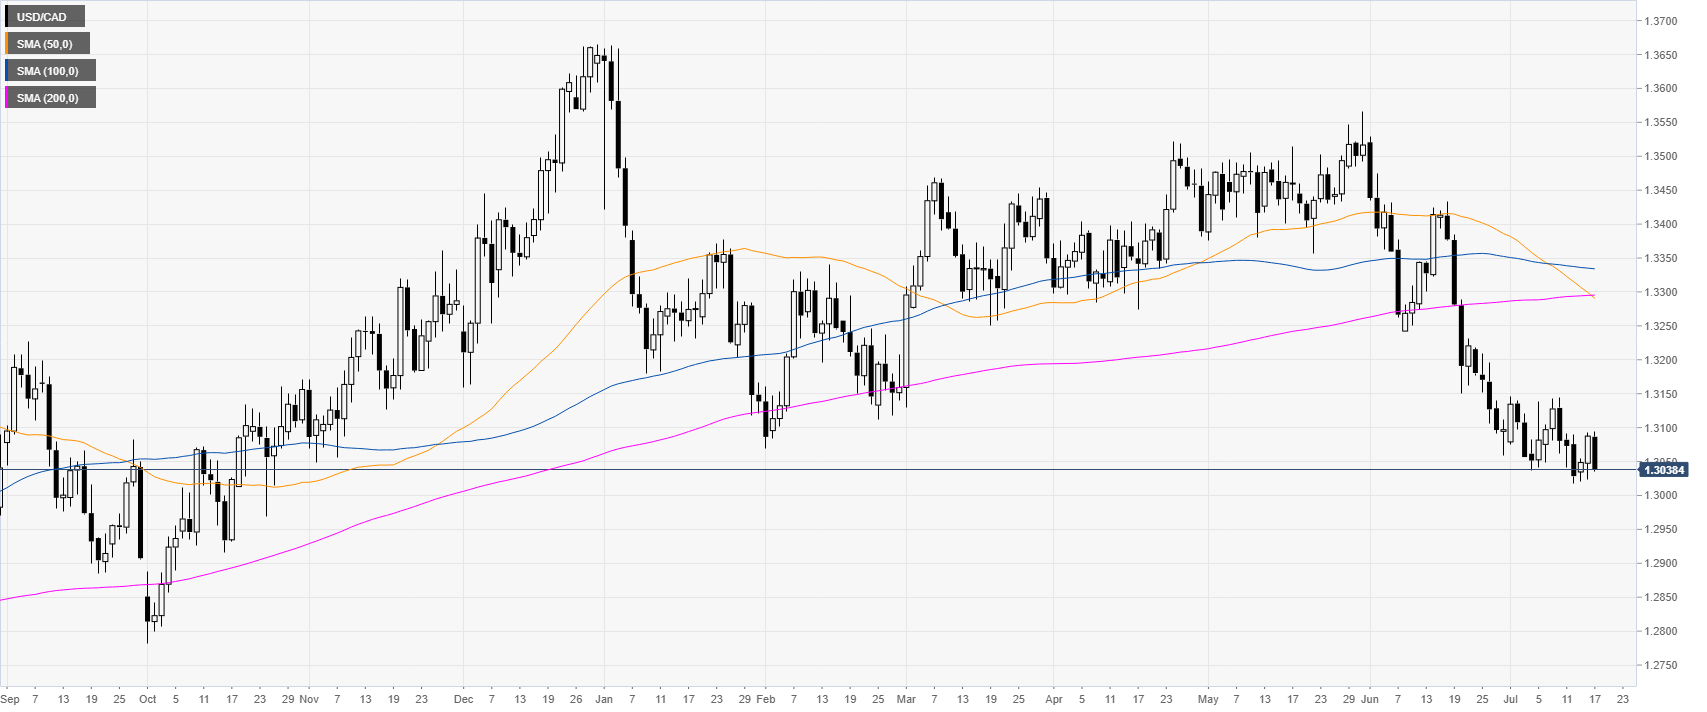
USD/CAD daily chart
USD/CAD is under pressure near multi-month lows as the market is trading below 1.3100 and the main daily simple moving averages (DSMAs).
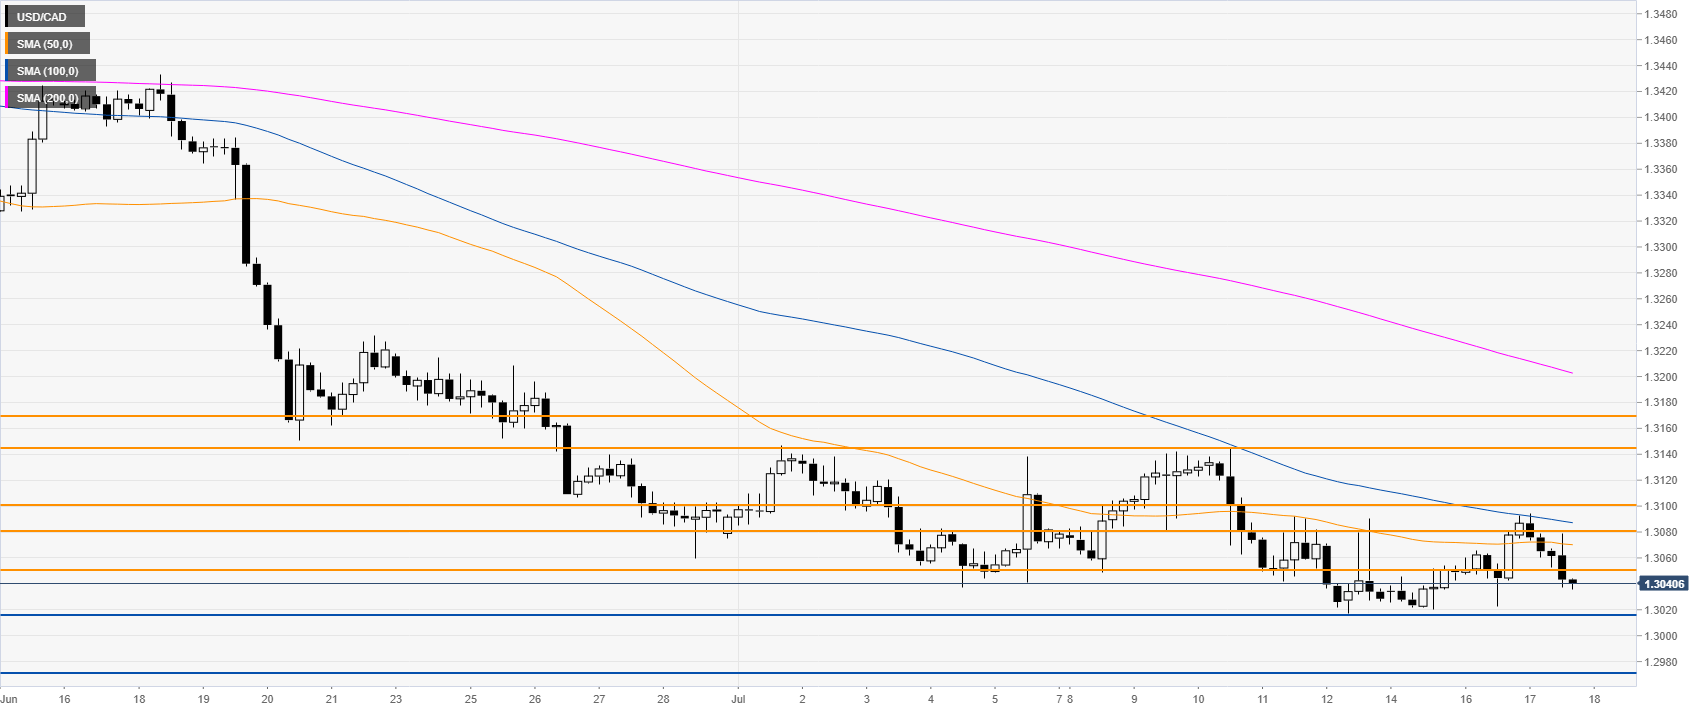
USD/CAD 4-hour chart
The market is declining below its main SMAs as bears are trying to reach 1.3016 support If broken, further down lies 1.2770, according to the Technical Confluences Indicator.
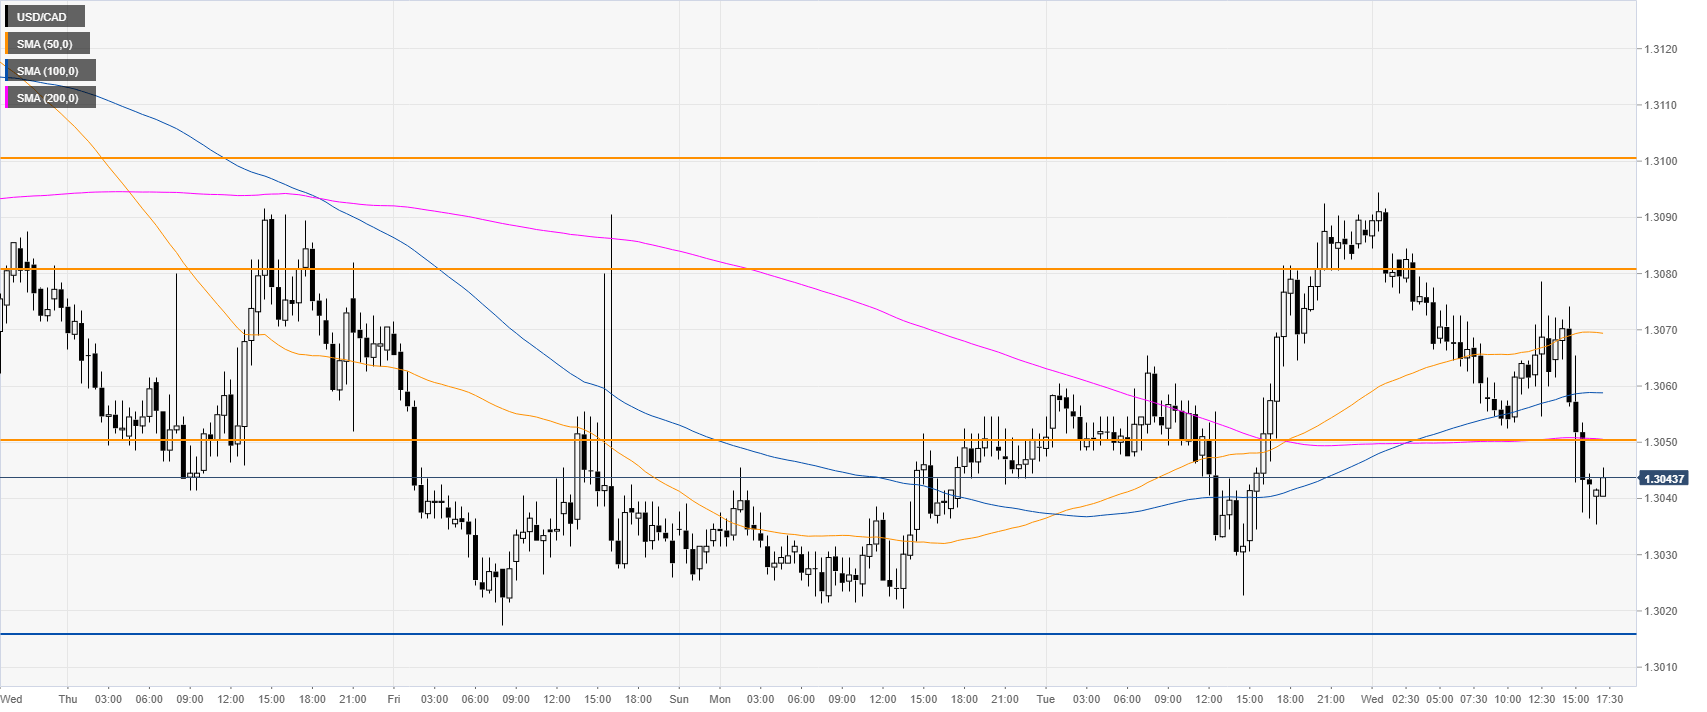
USD/CAD 30-minute chart
The market is trading withing the ranfge of the last four days. Bulls have a lot of work as they have to overcome 1.3050 and the main SMAs. If the bulls can overcome 1.3050, the next resistances can become 1.3080, 1.3100 and 1.3150, according to the Technical Confluences Indicator.
Additional key levels
