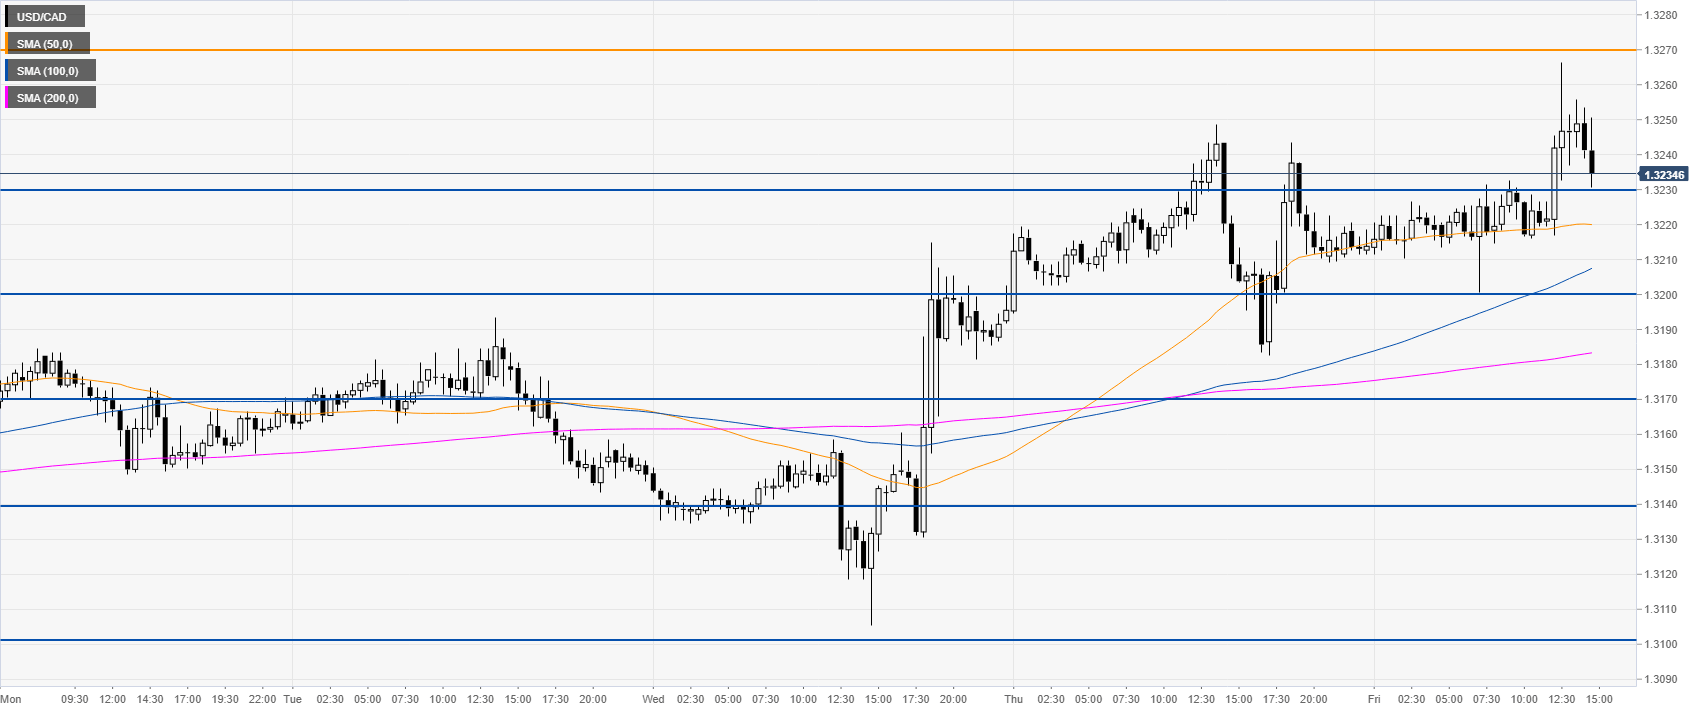
- USD/CAD is grinding up as the market is currently supported at the 1.3230 level.
- The levels to beat for bulls are the 1.3270 resistance followed by the 1.3300 figure.
USD/CAD daily chart
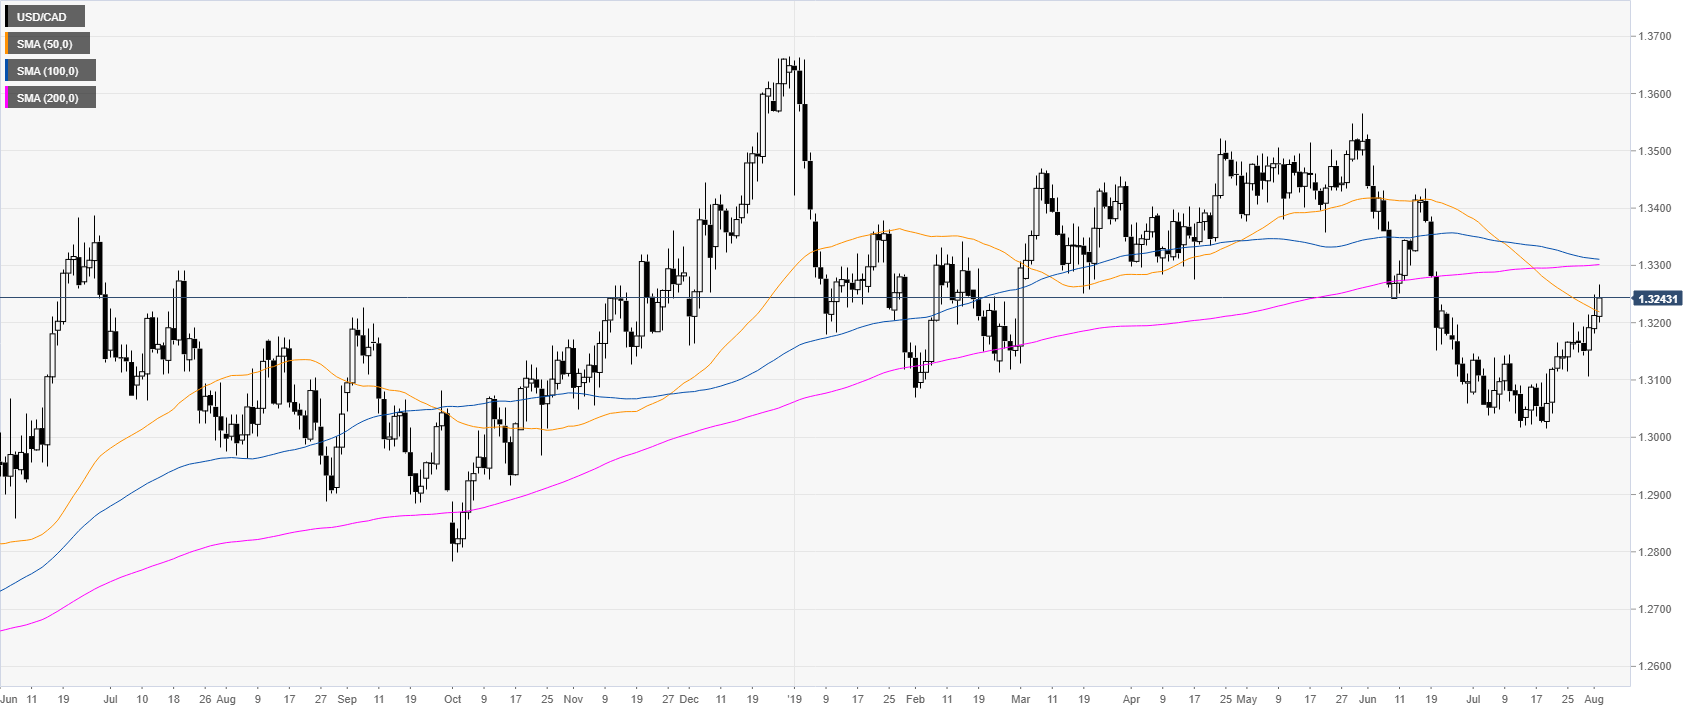
USD/CAD is trading above the 1.3200 level and its 50-day simple moving averages (DSMA) suggesting a correction up.
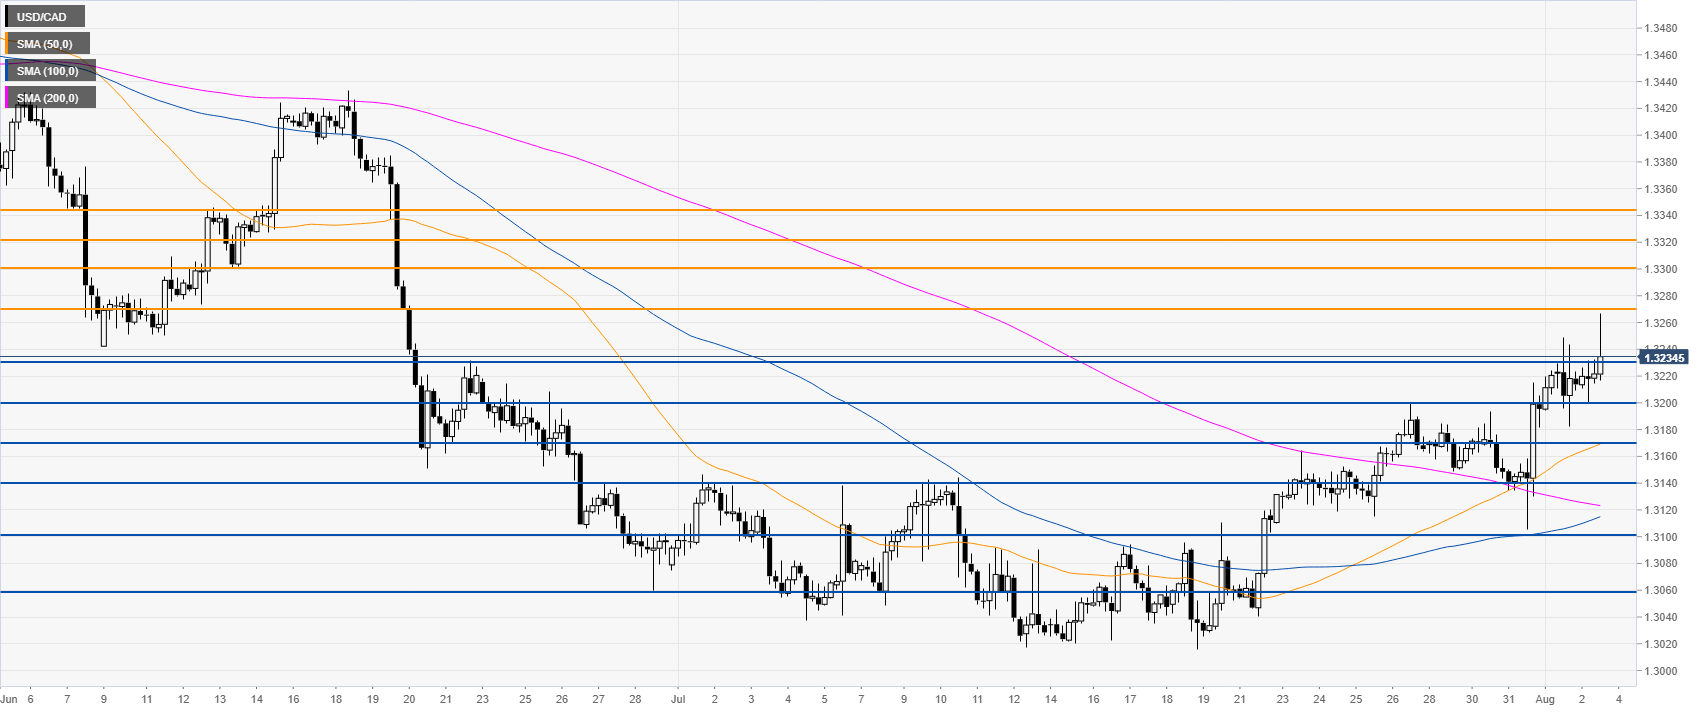
USD/CAD 4-hour chart
USD/CAD is trading above its main SMAs, suggesting a bullish bias in the medium term. Bulls next resistances are seen near 1.3270, 1.3300, 1.3320 and 1.3345, according to the Technical Confluences Indicator.
USD/CAD 30-minute chart
The market is currently retracing from daily highs while trading above its main SMAs. The correction can find initial support at 1.3230, 1.3200 and 1.3170, according to the Technical Confluences Indicator.
Additional key levels
