- USD/CAD is choppy at the start of the New York session, holding just above the 1.3200 handle.
- The level to beat for bulls is the 1.3212/30 resistance zone.
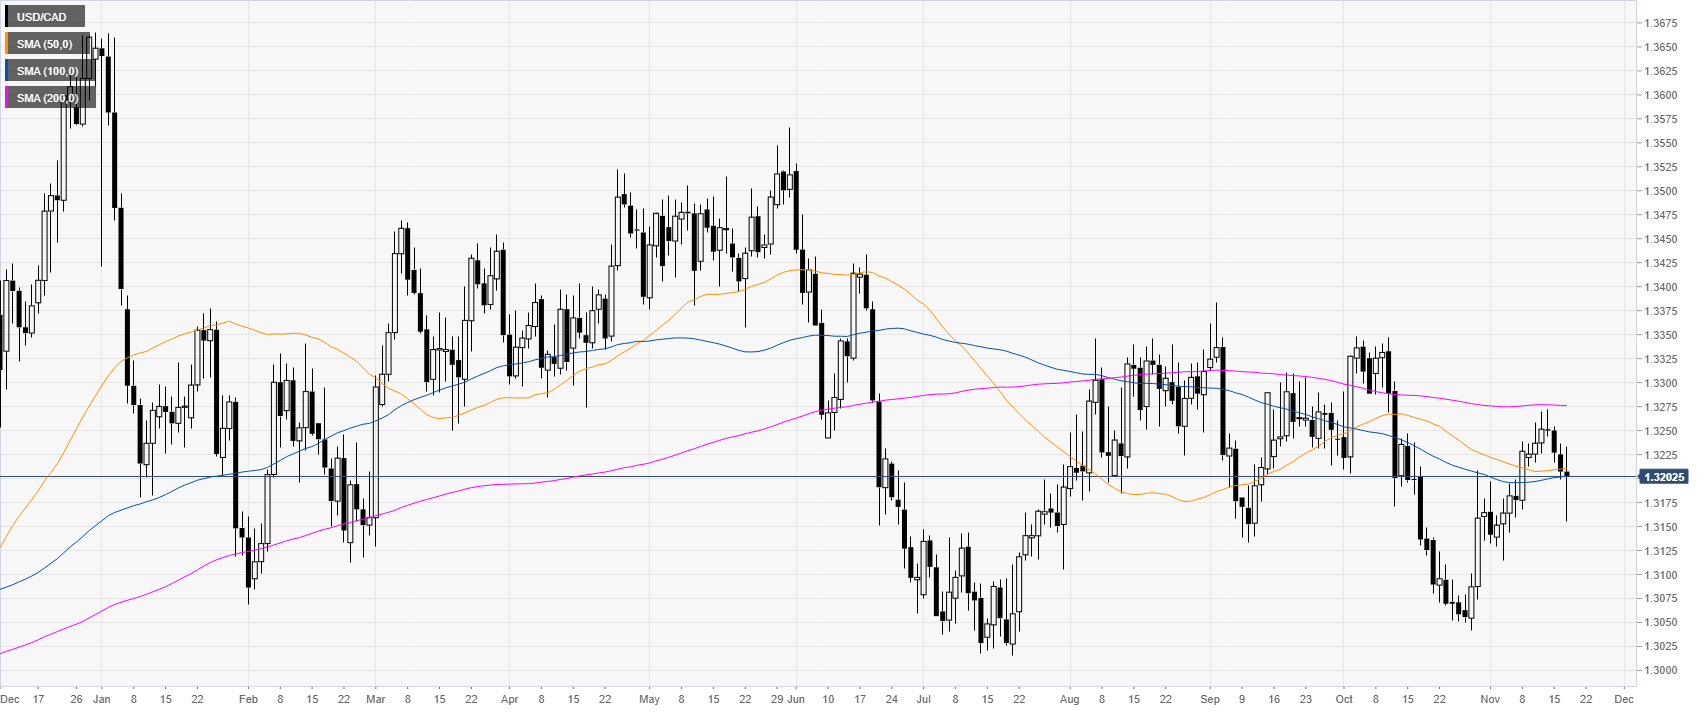
USD/CAD daily chart
The Loonie on the daily chart is trading just above the 1.3200 handle and the 100-day simple moving average (DMA).
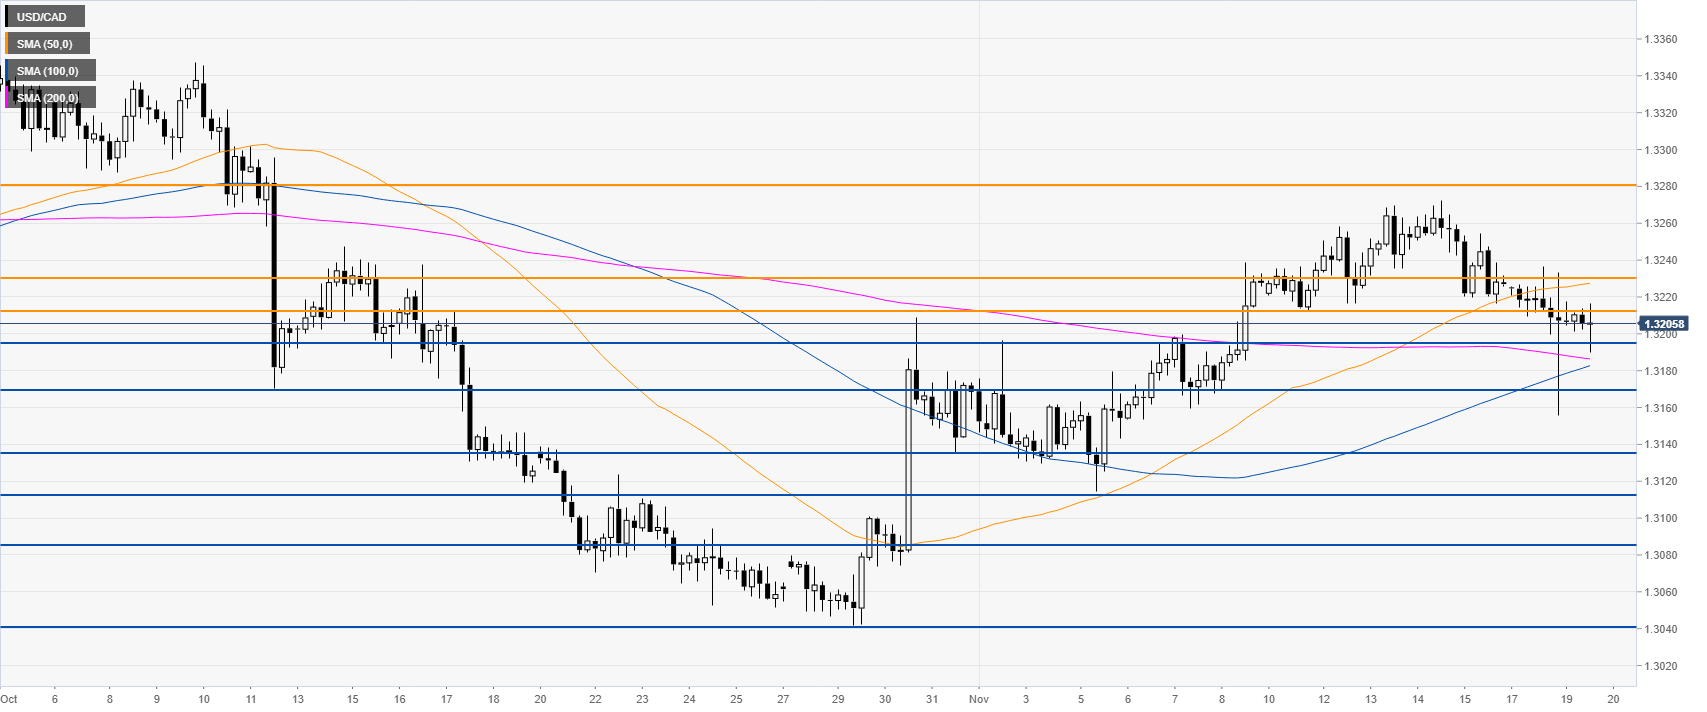
USD/CAD four-hour chart
USD/CAD is trading above the 100 and 200 SMAs, suggesting bullish momentum in the medium term. The market is in a bull flag as buyers will try to penetrate above the 1.3212/30 resistance zone. The next main resistance on the way up is seen at the 1.3280 level, according to the Technical Confluences Indicator.
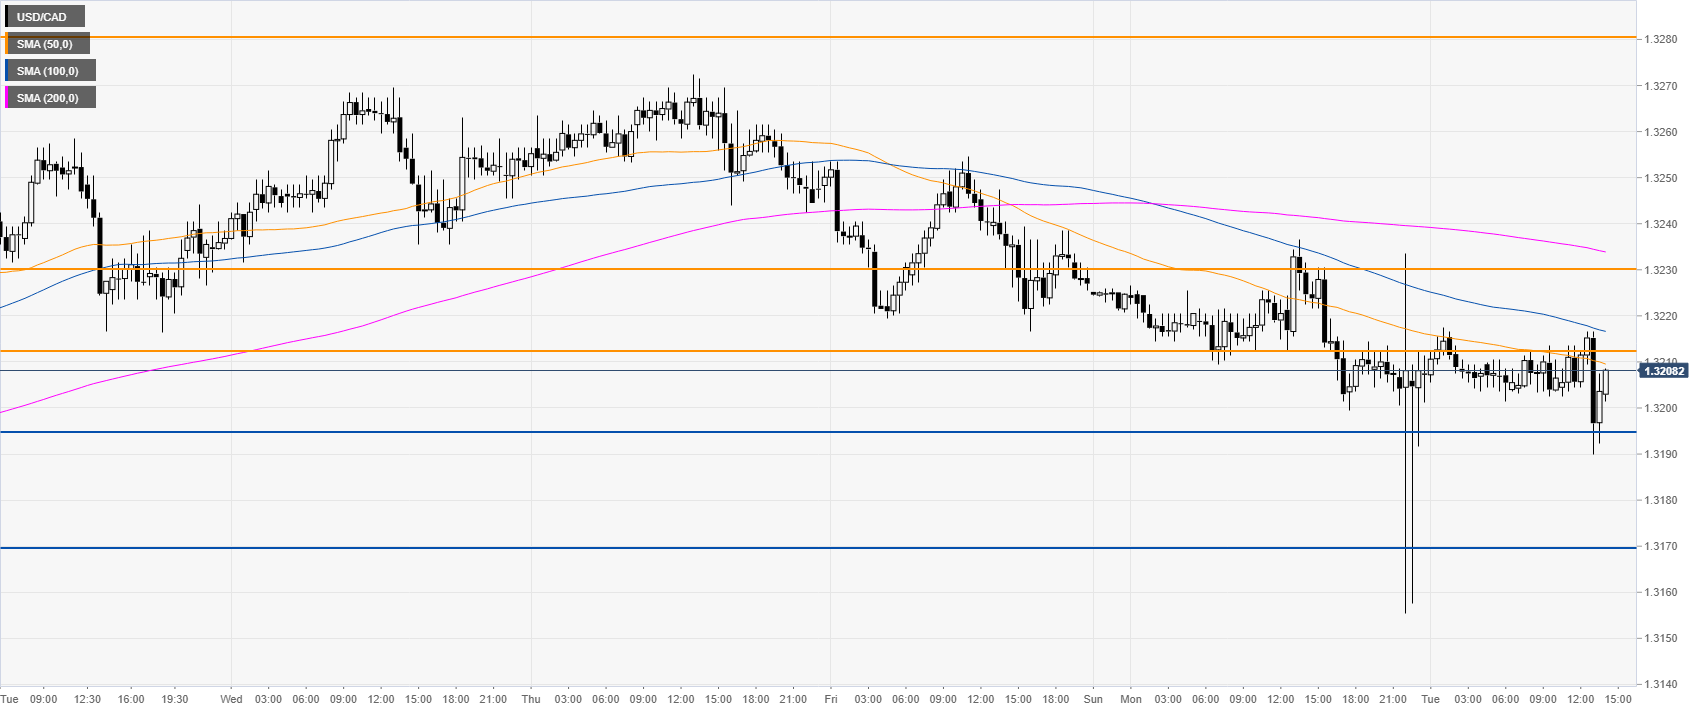
USD/CAD 30-minute chart
USD/CAD is trading below its main SMAs, suggesting a bearish momentum in the near term. Support is seen at 1.3195 level, followed by the 1.3170 level, according to the Technical Confluences Indicator.
Additional key levels
