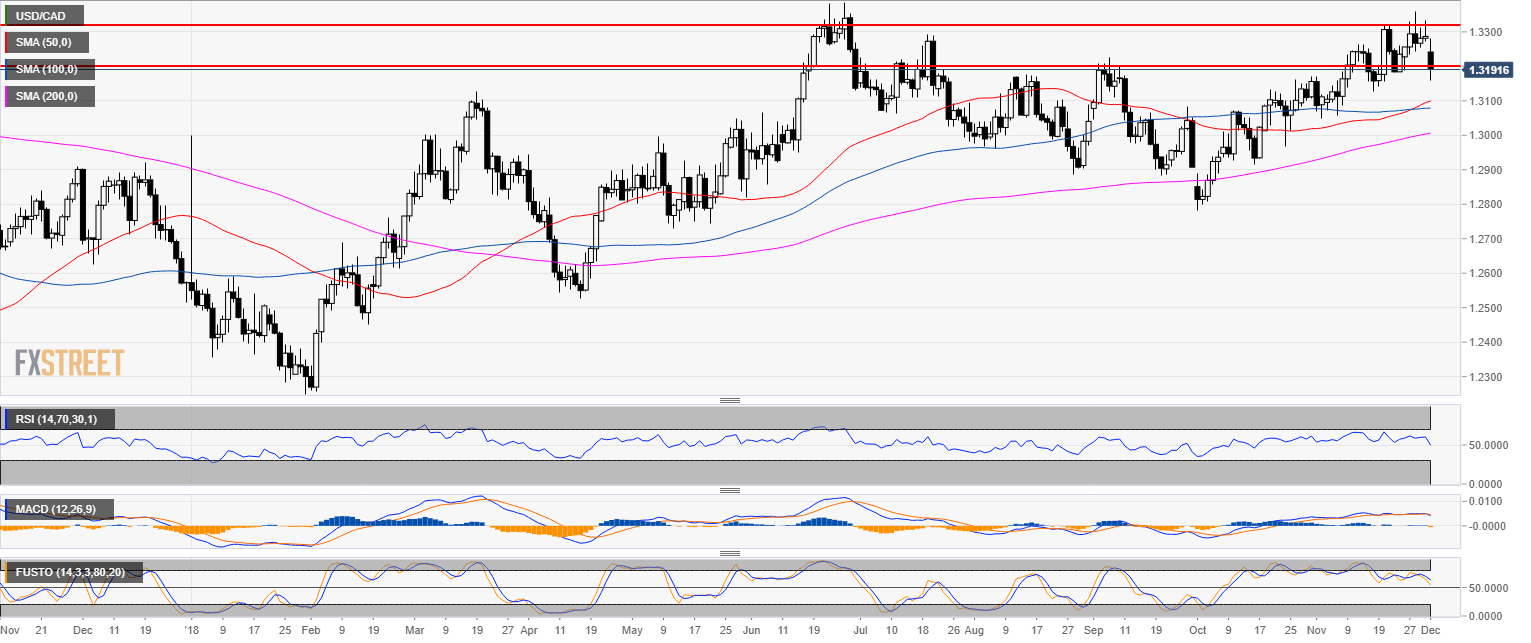
USD/CAD daily chart
- USD/CAD is trading in a bull trend below the 200-day simple moving average (SMA).
- USD/CAD took deep dive to the 1.3150 level.
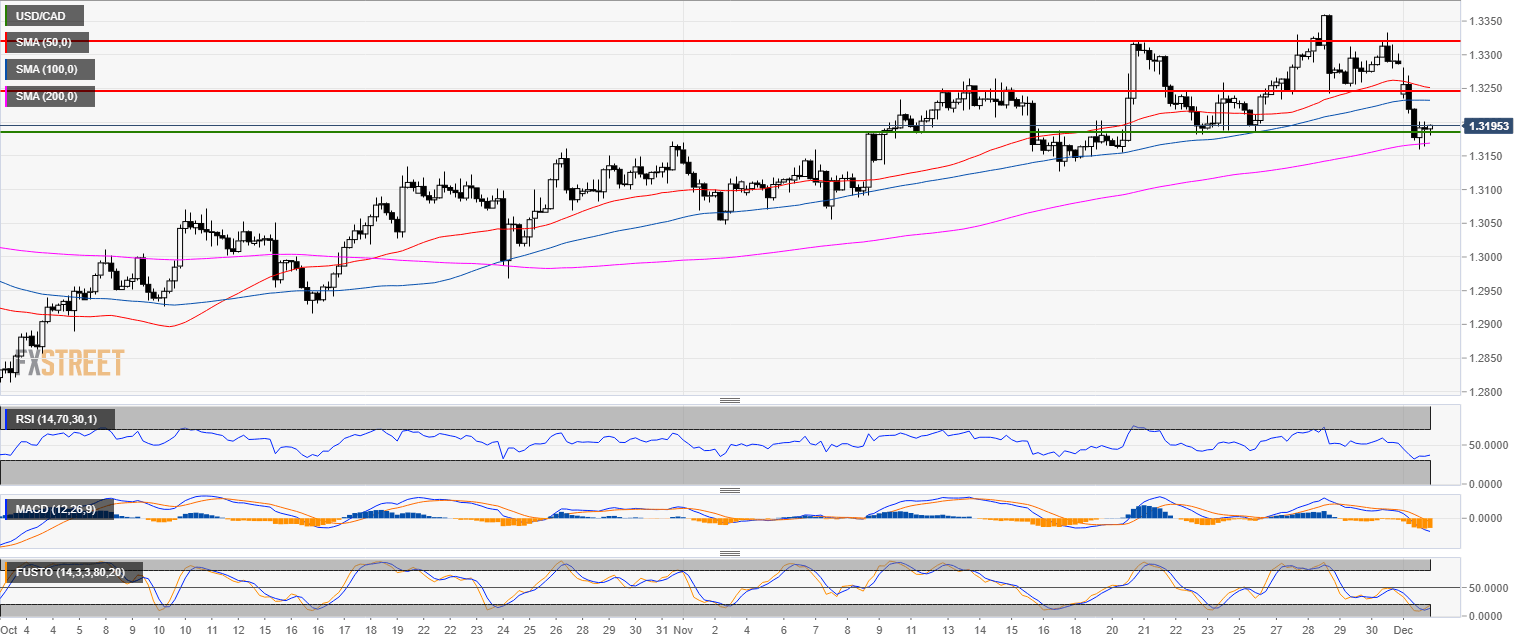
USD/CAD 4-hour chart
- USD/CAD found some support at the 200 SMA.
- Technical indicators are in bearish territories.
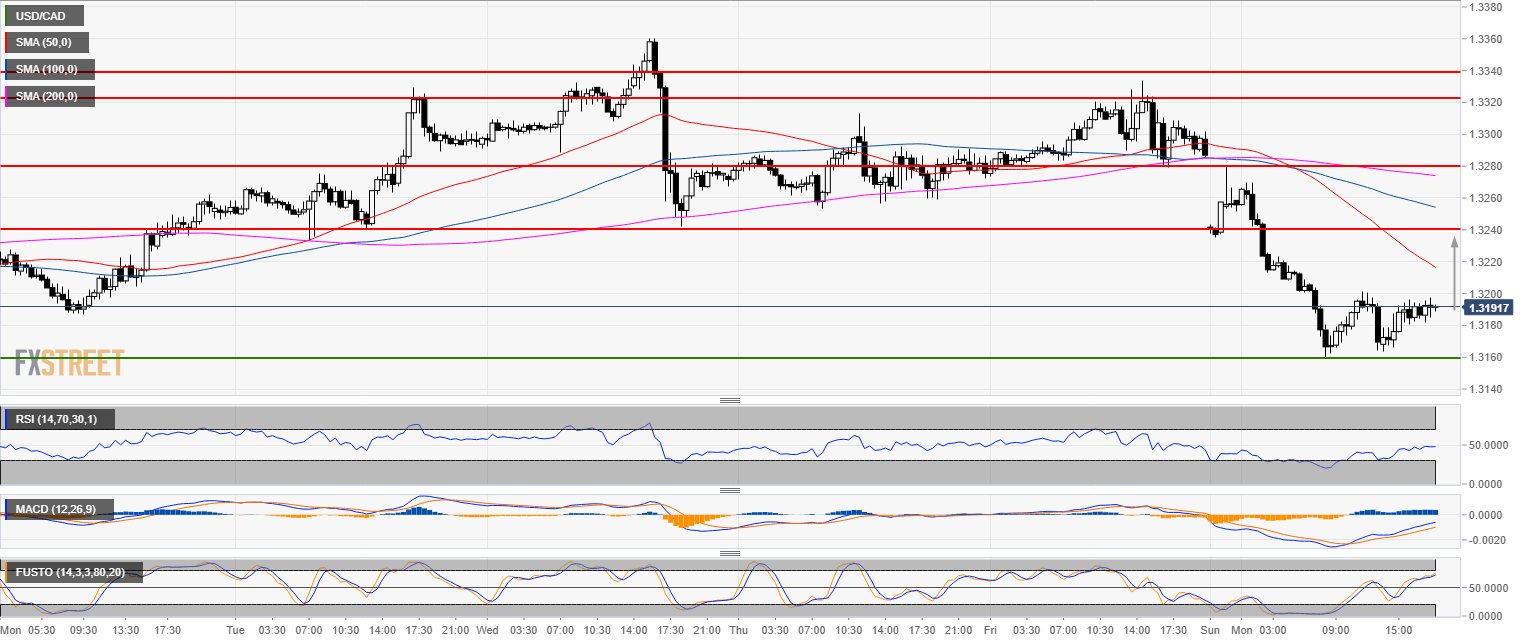
USD/CAD 30-minute chart
- On smaller time-frames, the 1.3160 support is holding.
- Bulls are targeting the 1.3240 level.
Additional key levels
USD/CAD
Overview:
Today Last Price: 1.3188
Today Daily change: -99 pips
Today Daily change %: -0.745%
Today Daily Open: 1.3287
Trends:
Previous Daily SMA20: 1.3215
Previous Daily SMA50: 1.3095
Previous Daily SMA100: 1.3079
Previous Daily SMA200: 1.3001
Levels:
Previous Daily High: 1.3334
Previous Daily Low: 1.3272
Previous Weekly High: 1.336
Previous Weekly Low: 1.3187
Previous Monthly High: 1.336
Previous Monthly Low: 1.3048
Previous Daily Fibonacci 38.2%: 1.331
Previous Daily Fibonacci 61.8%: 1.3296
Previous Daily Pivot Point S1: 1.3262
Previous Daily Pivot Point S2: 1.3237
Previous Daily Pivot Point S3: 1.3201
Previous Daily Pivot Point R1: 1.3323
Previous Daily Pivot Point R2: 1.3359
Previous Daily Pivot Point R3: 1.3384
