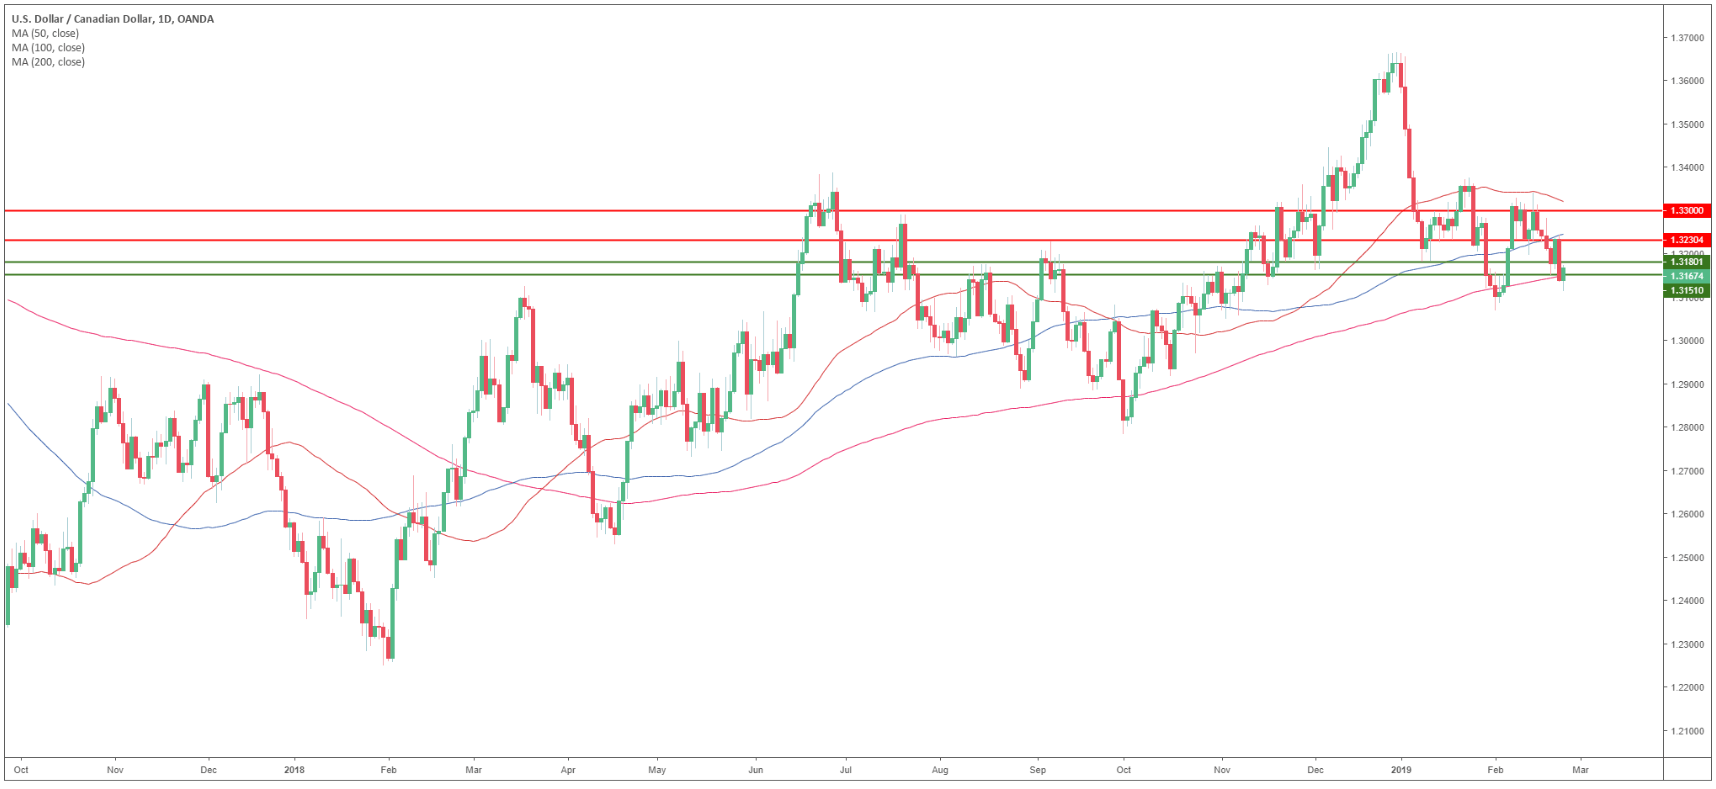
USD/CAD daily chart
- USD/CAD is trading in a bull trend above the 200-day simple moving average (SMA).
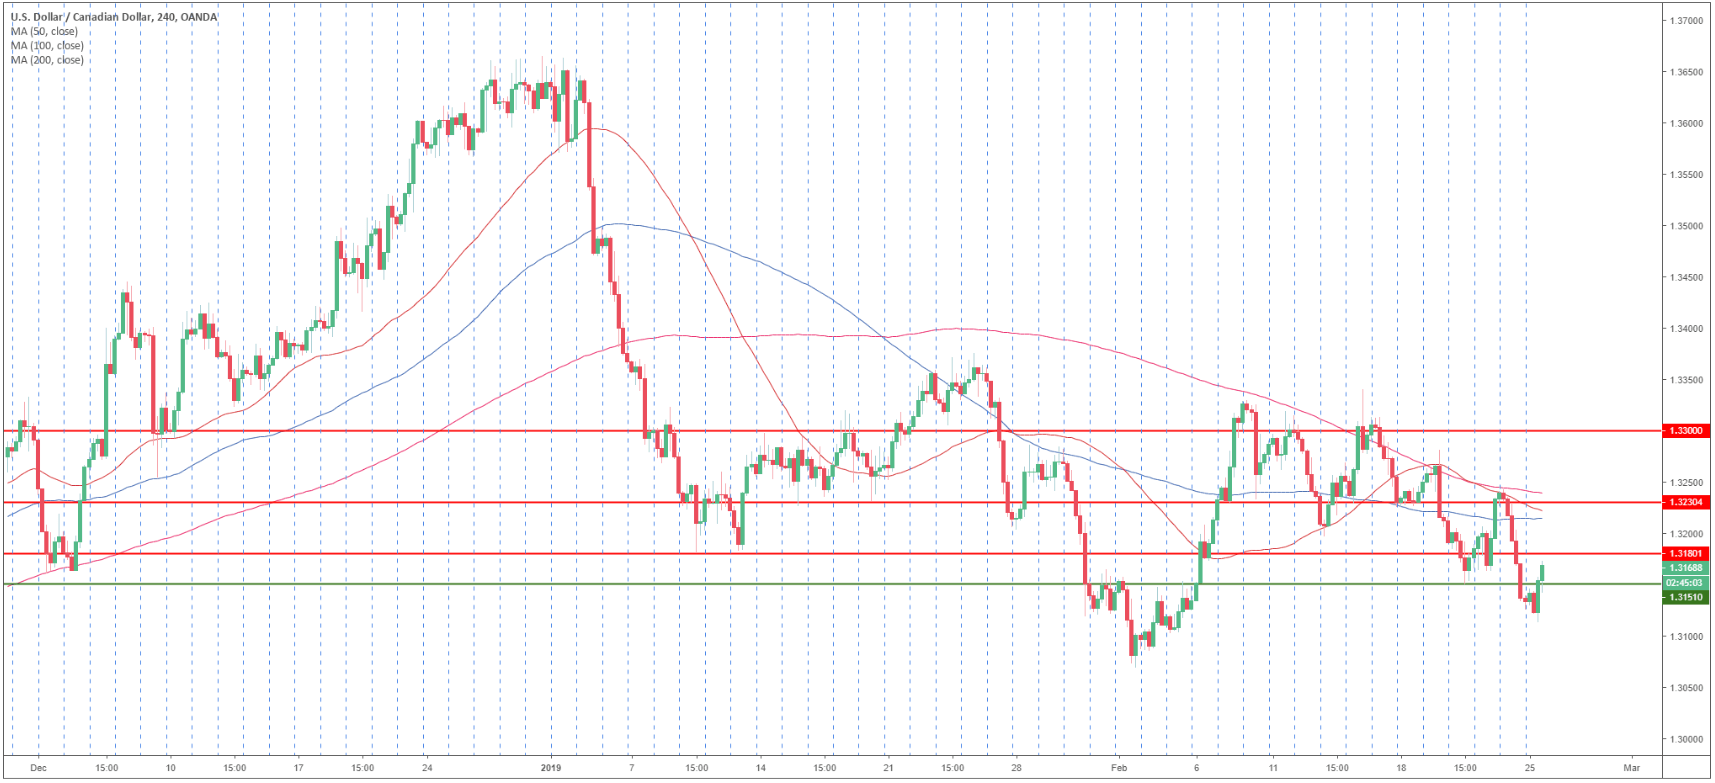
USD/CAD 4-hour chart
- USD/CAD is trading below its main SMAs suggesting a bearish bias in the medium-term.
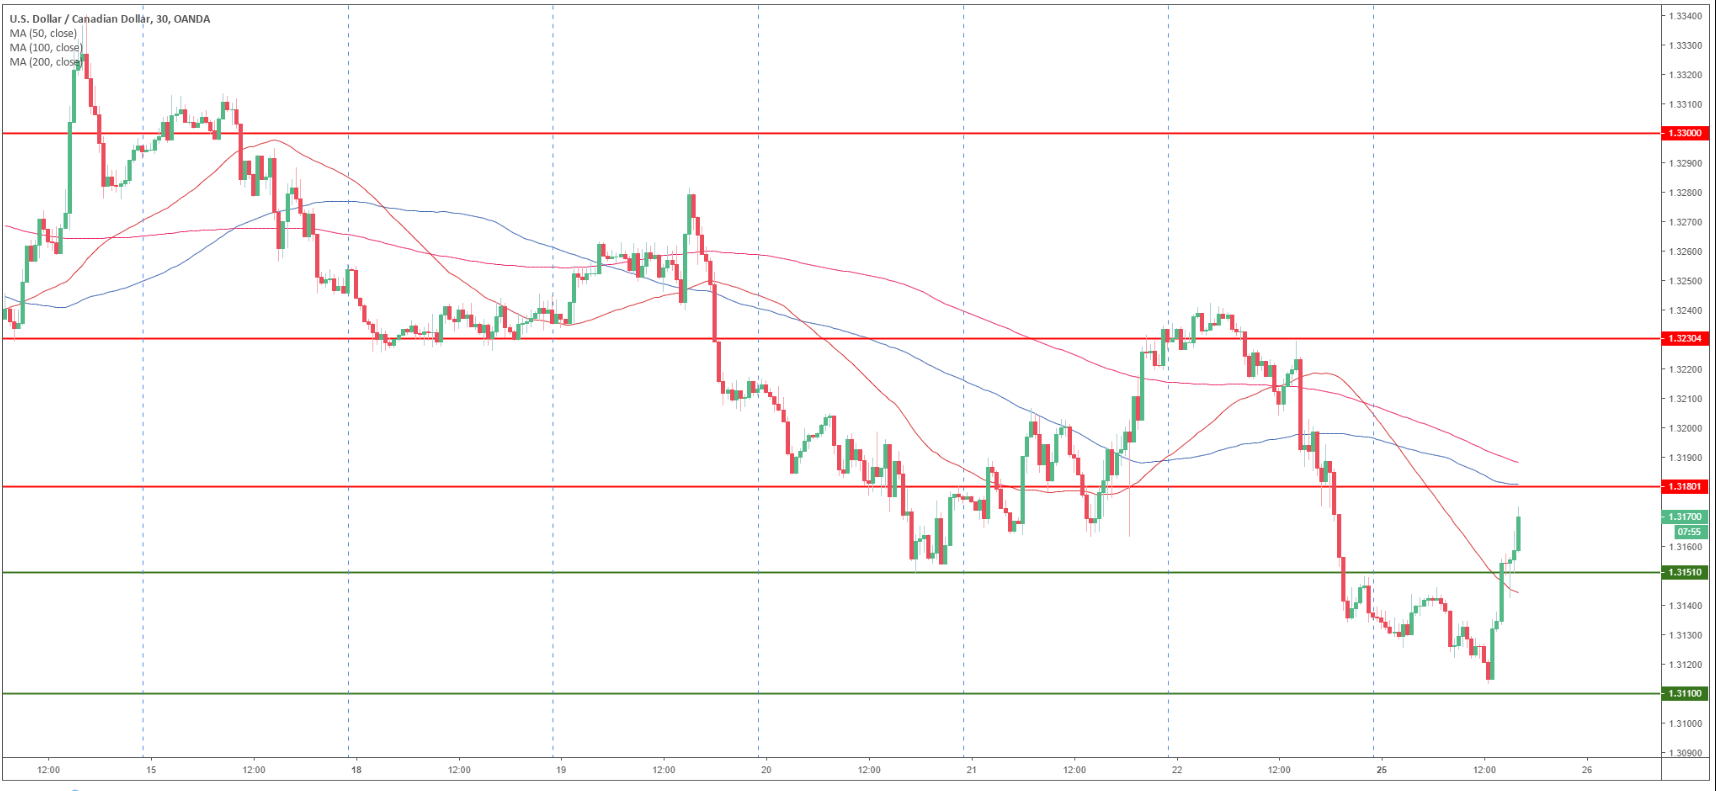
USD/CAD 30-minute chart
- USD/CAD is trading between the 50 and 100 SMA suggesting sideways action in the short-term.
- USD/CAD bulls are gathering some traction and they need to overcome the 1.3180 resistance to travel to the 1.3230 resistance.
- Supports are at 1.3150 and 1.3110 level.
Additional key levels
USD/CAD
Overview:
Today Last Price: 1.3168
Today Daily change: 22 pips
Today Daily change %: 0.17%
Today Daily Open: 1.3146
Trends:
Daily SMA20: 1.3212
Daily SMA50: 1.3345
Daily SMA100: 1.3262
Daily SMA200: 1.3158
Levels:
Previous Daily High: 1.3245
Previous Daily Low: 1.3134
Previous Weekly High: 1.3294
Previous Weekly Low: 1.3134
Previous Monthly High: 1.3664
Previous Monthly Low: 1.3118
Daily Fibonacci 38.2%: 1.3176
Daily Fibonacci 61.8%: 1.3203
Daily Pivot Point S1: 1.3104
Daily Pivot Point S2: 1.3063
Daily Pivot Point S3: 1.2992
Daily Pivot Point R1: 1.3216
Daily Pivot Point R2: 1.3287
Daily Pivot Point R3: 1.3328
