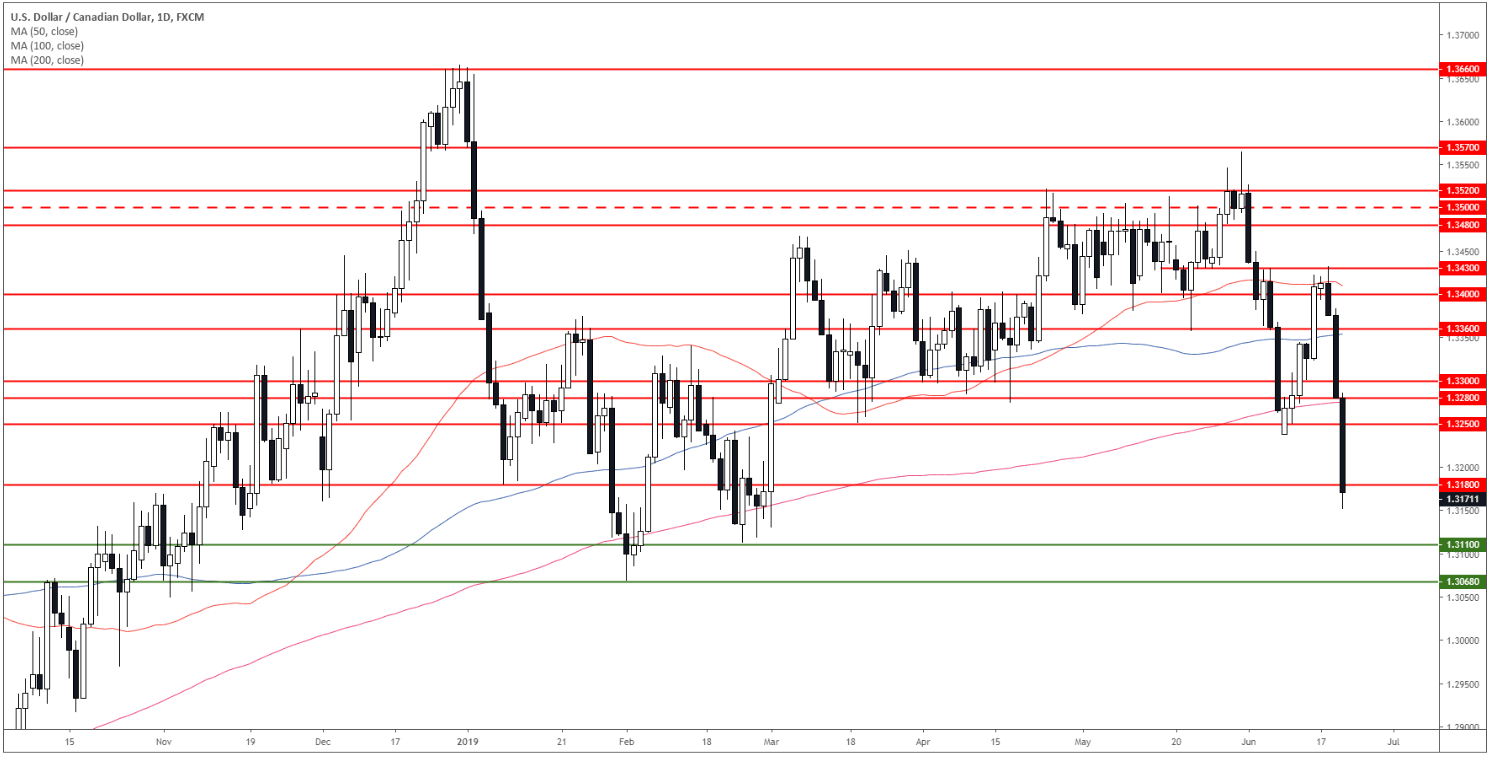
- USD/CAD is trading at levels not seen since March.
- The next supports to the downside are seen near 1.3110 and 1.3068.
USD/CAD daily chart
USD/CAD broke below 1.3200 figure and its main daily simple moving average (DSMA). The overall picture is turning negative for the commodity-linked currency pair.

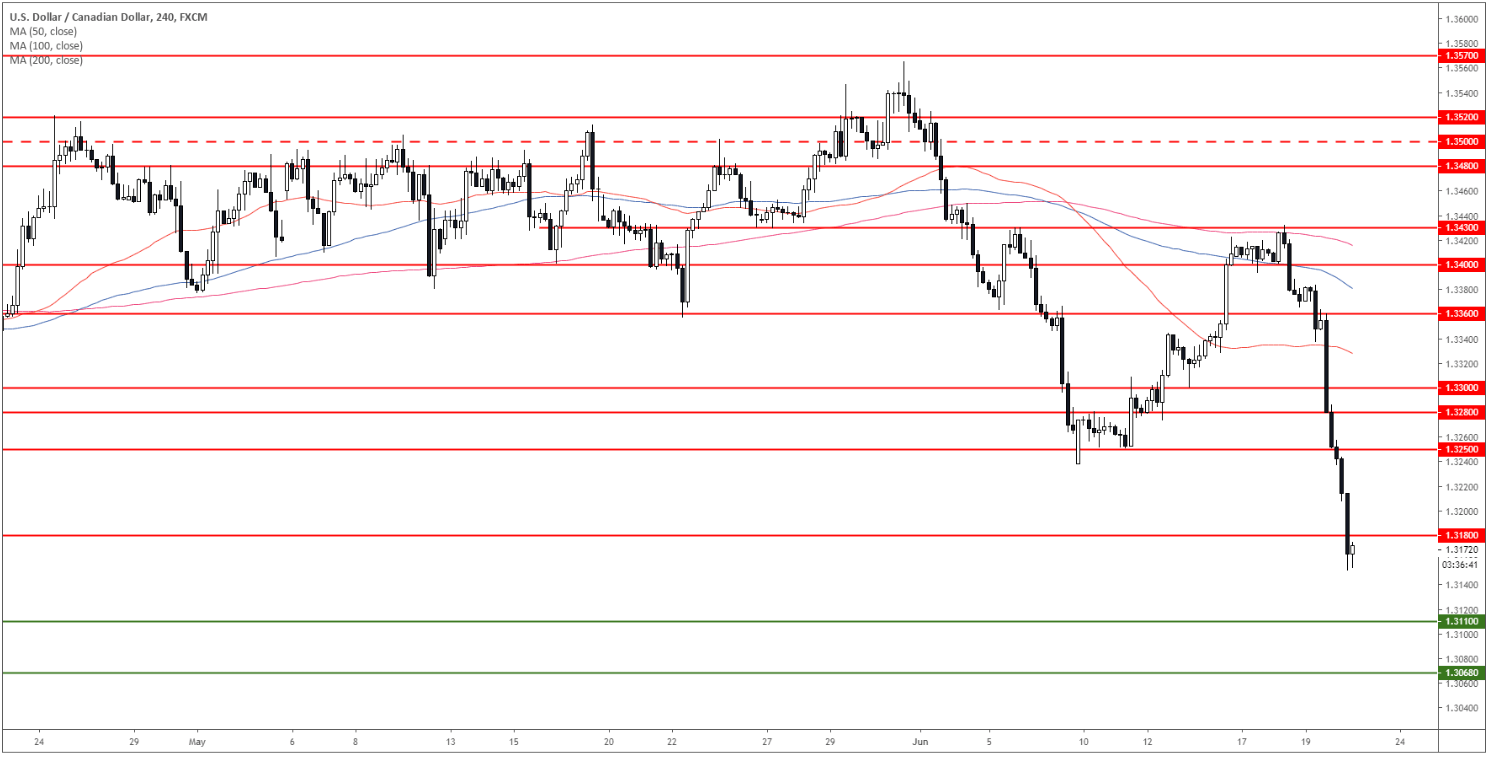
USD/CAD 4-hour chart
USD/CAD is under bearish pressure below 1.3180 and its main SMAs. The market reached levels not seen since March of this year.

USD/CAD 30-minute chart
The 50 SMA crossed below the 200 SMA which is seen as a bearish sign. The path of least resistance is to the downside. The next support cab be seen at 1.3110 (near weekly Pivot Point S3) and 1.3068 ( February low).
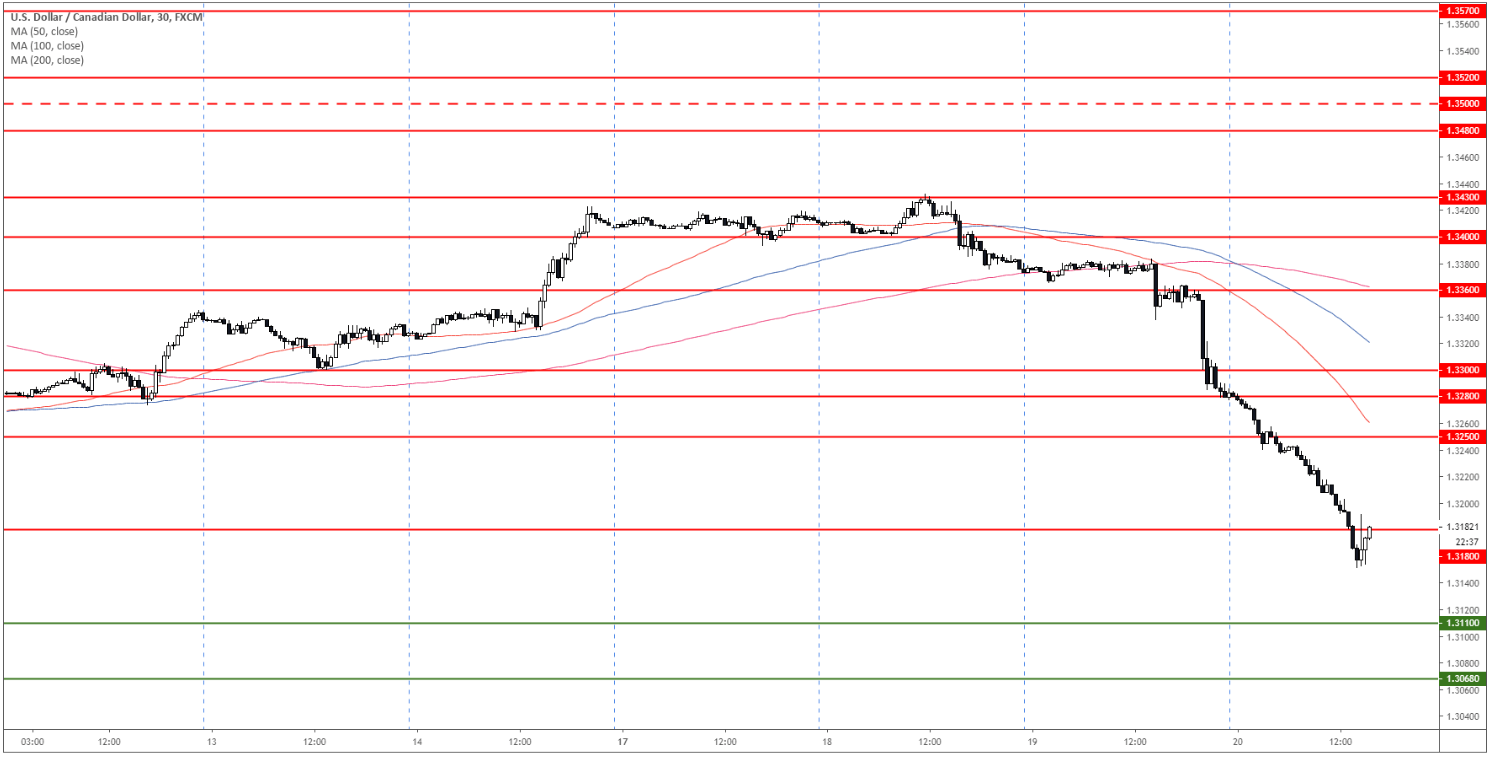
Additional key levels
