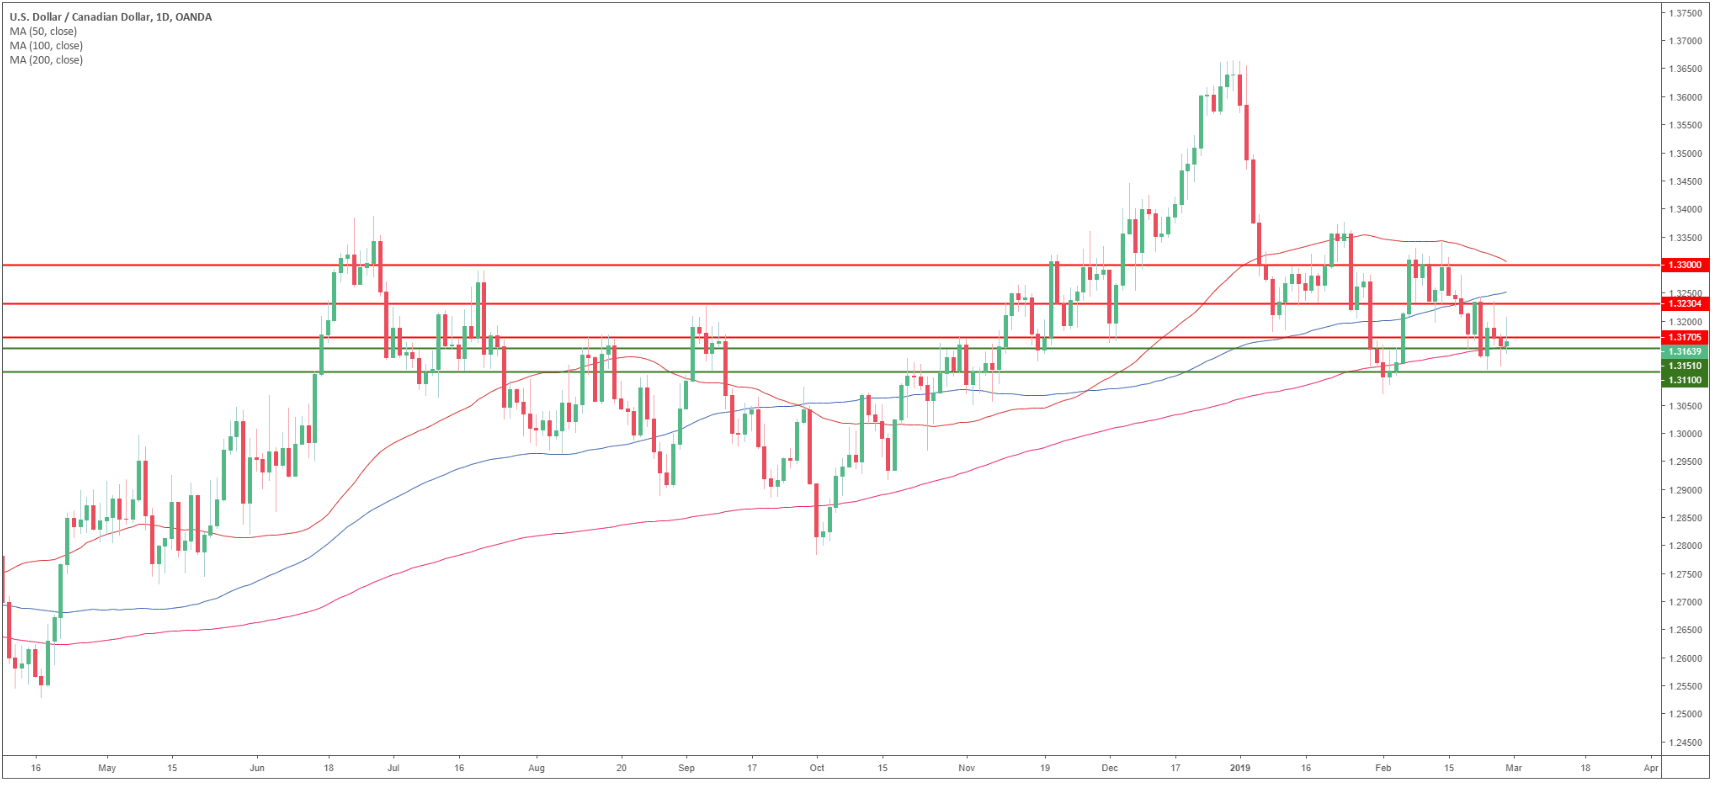
USD/CAD daily chart
- USD/CAD is in consolidation mode since the start of the year.
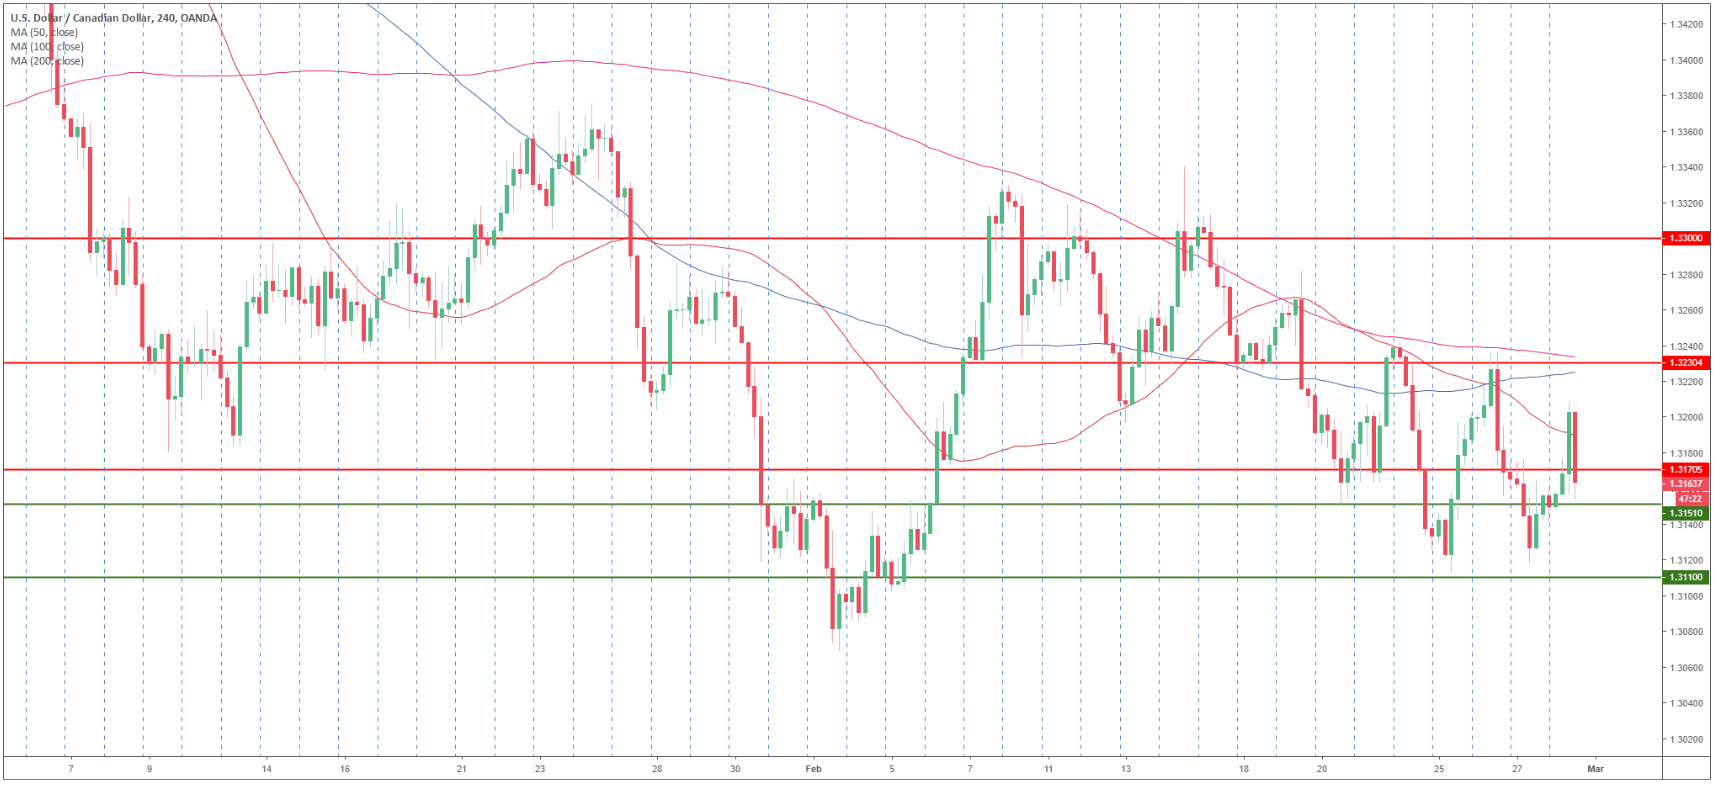
USD/CAD 4-hour chart
- USD/CAD is trading below its main SMAs suggesting bearish momentum in the medium-term.
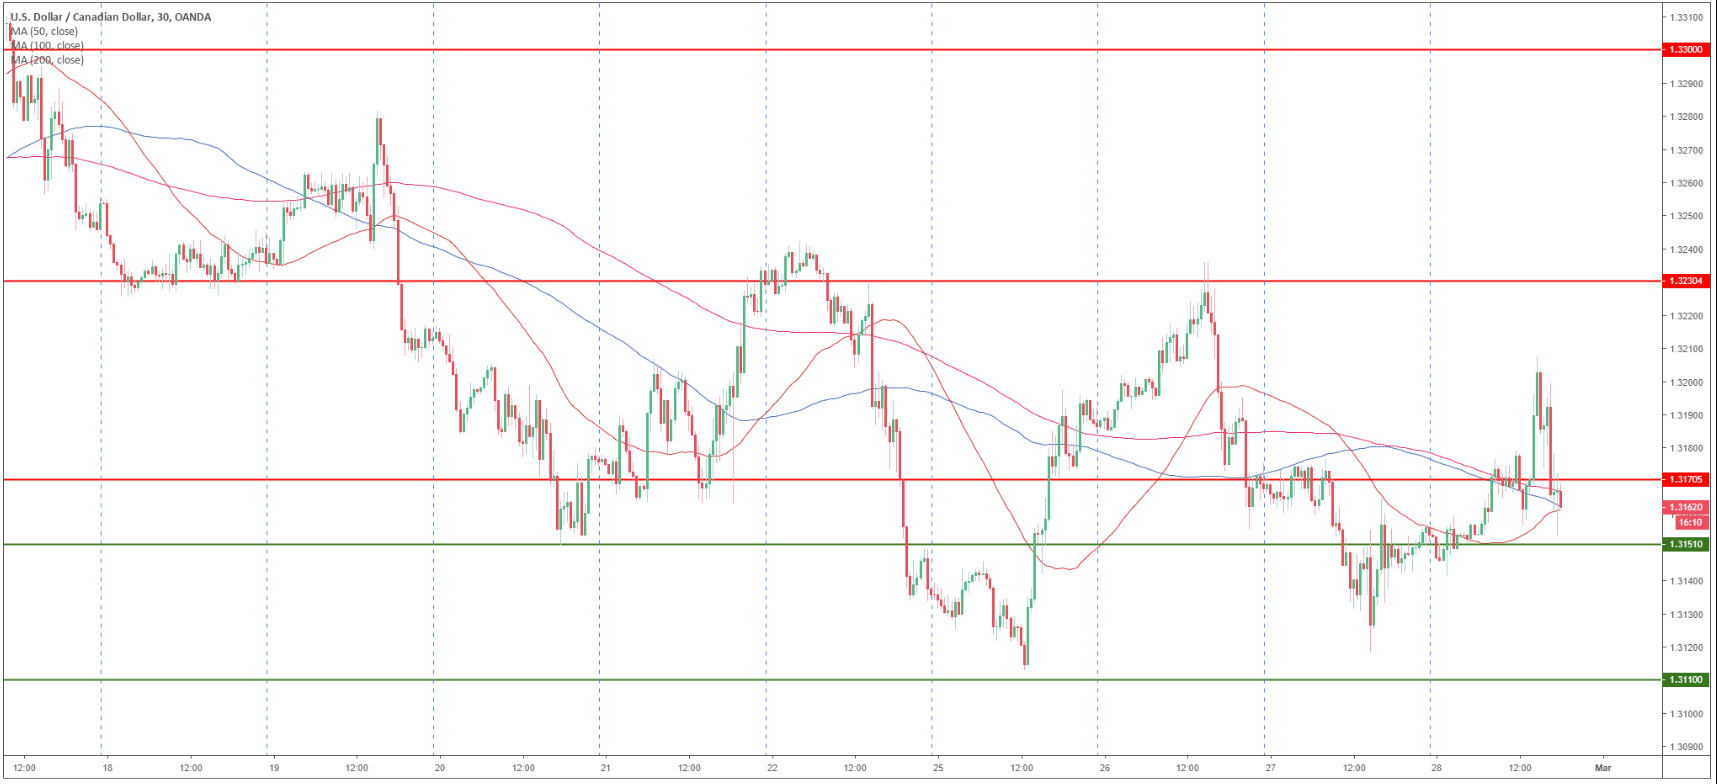
USD/CAD 30-minute chart
- USD/CAD rejected the 1.3200 figure as the SMAs are coiled together.
- A break below 1.3150 on a daily closing basis would open the gates to 1.3110 support.
- Resistances are at 1.3170, 1.3200 figure and 1.3230 level.
Additional key levels
USD/CAD
Overview:
Today Last Price: 1.3163
Today Daily change: 11 pips
Today Daily change %: 0.08%
Today Daily Open: 1.3152
Trends:
Daily SMA20: 1.3204
Daily SMA50: 1.3328
Daily SMA100: 1.3267
Daily SMA200: 1.3163
Levels:
Previous Daily High: 1.318
Previous Daily Low: 1.3118
Previous Weekly High: 1.3294
Previous Weekly Low: 1.3134
Previous Monthly High: 1.3664
Previous Monthly Low: 1.3118
Daily Fibonacci 38.2%: 1.3141
Daily Fibonacci 61.8%: 1.3156
Daily Pivot Point S1: 1.3119
Daily Pivot Point S2: 1.3087
Daily Pivot Point S3: 1.3057
Daily Pivot Point R1: 1.3181
Daily Pivot Point R2: 1.3211
Daily Pivot Point R3: 1.3243
