- USD/CAD is spiking to new weekly highs above the 1.3200 handle.
- The level to beat for bulls is the 1.3260 resistance.
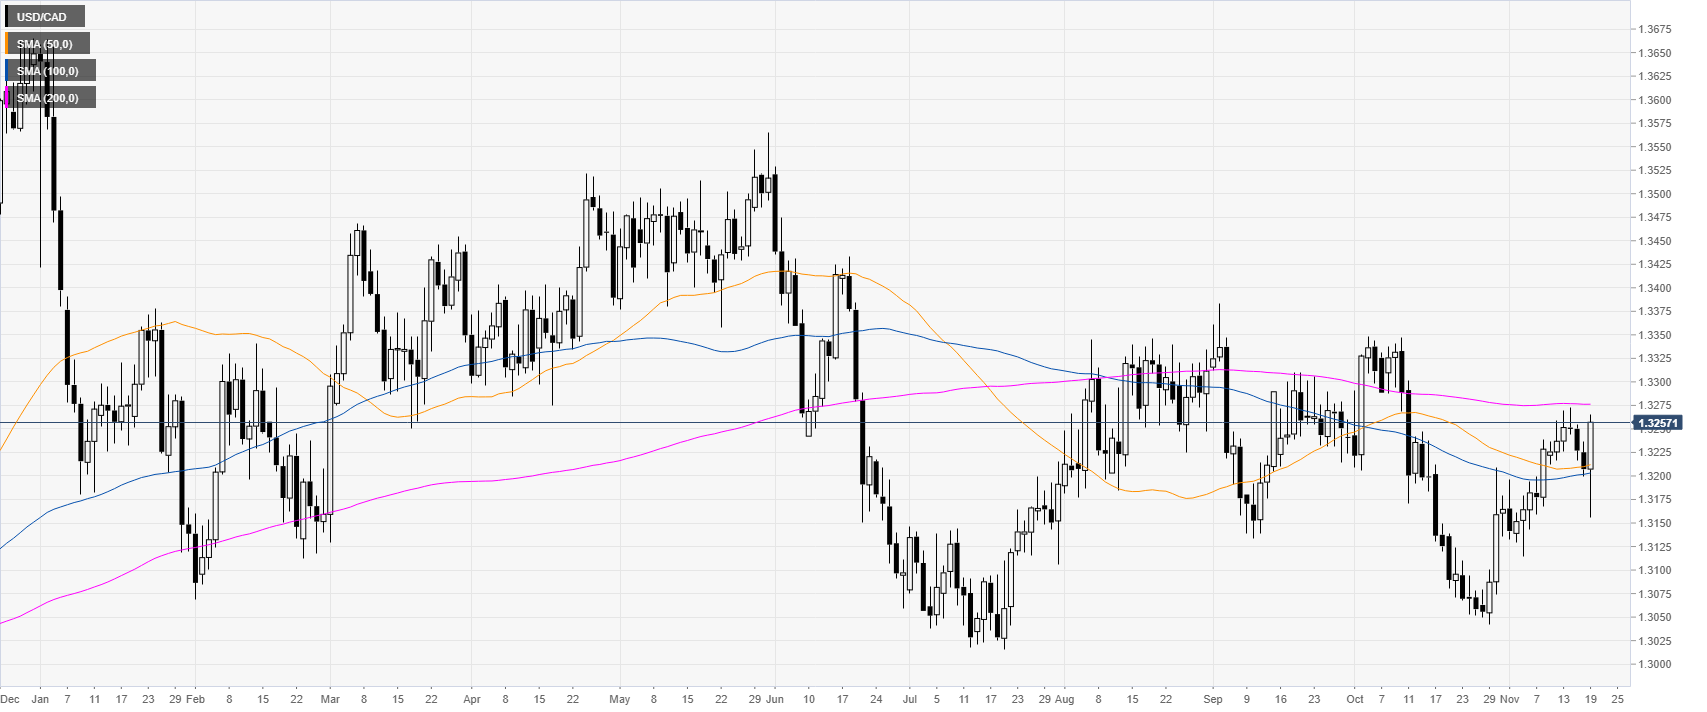
USD/CAD daily chart
The loonie on the daily chart is trading above the 1.3200 handle between the 50 and 200-day simple moving average (DMA).
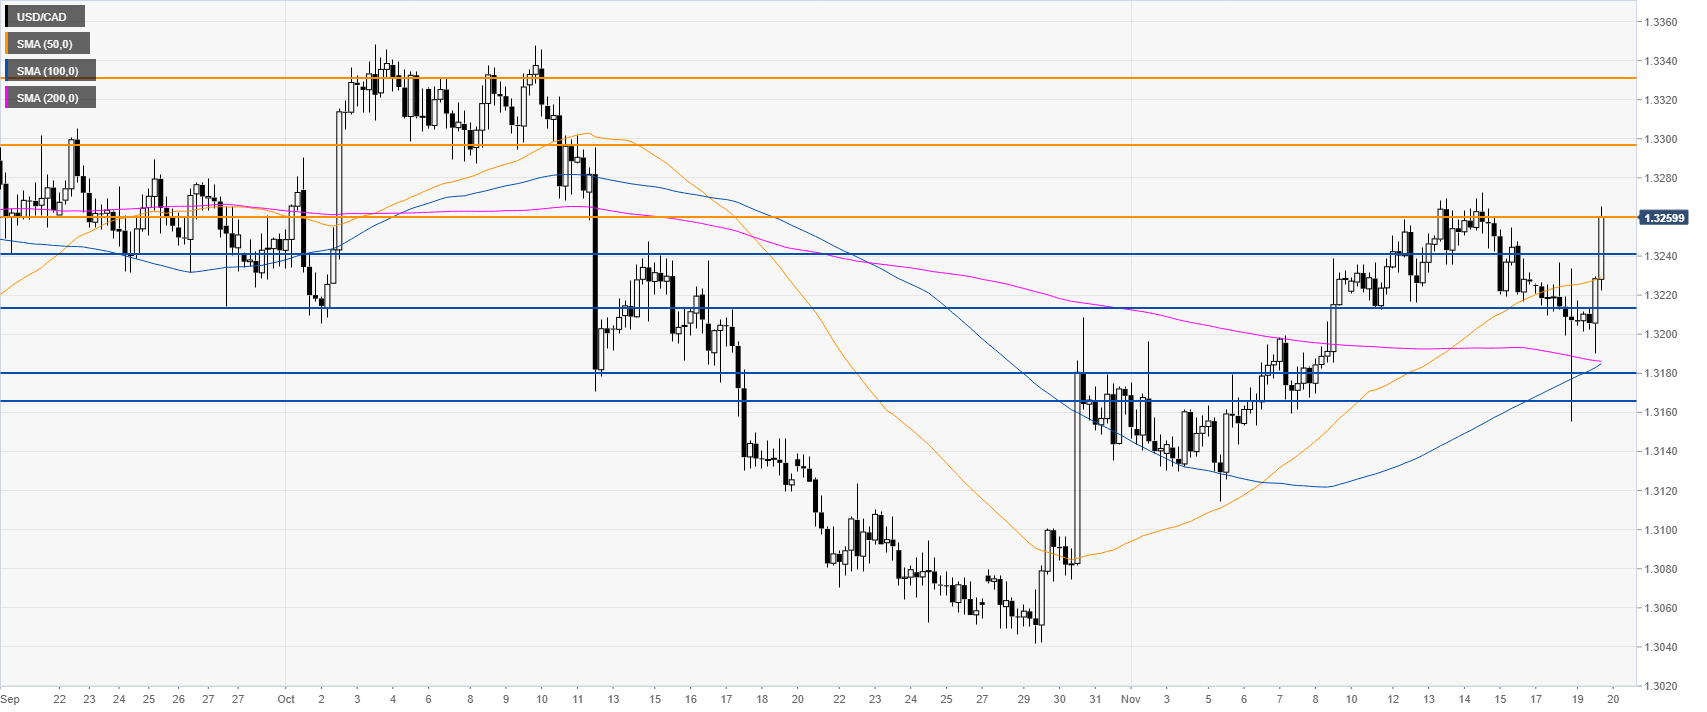
USD/CAD four-hour chart
USD/CAD is challenging the 1.3260 resistance while above the main SMAs. A daily break above the level can lead to further strength towards the 1.3296 and 1.3330 levels, according to the Technical Confluences Indicator.
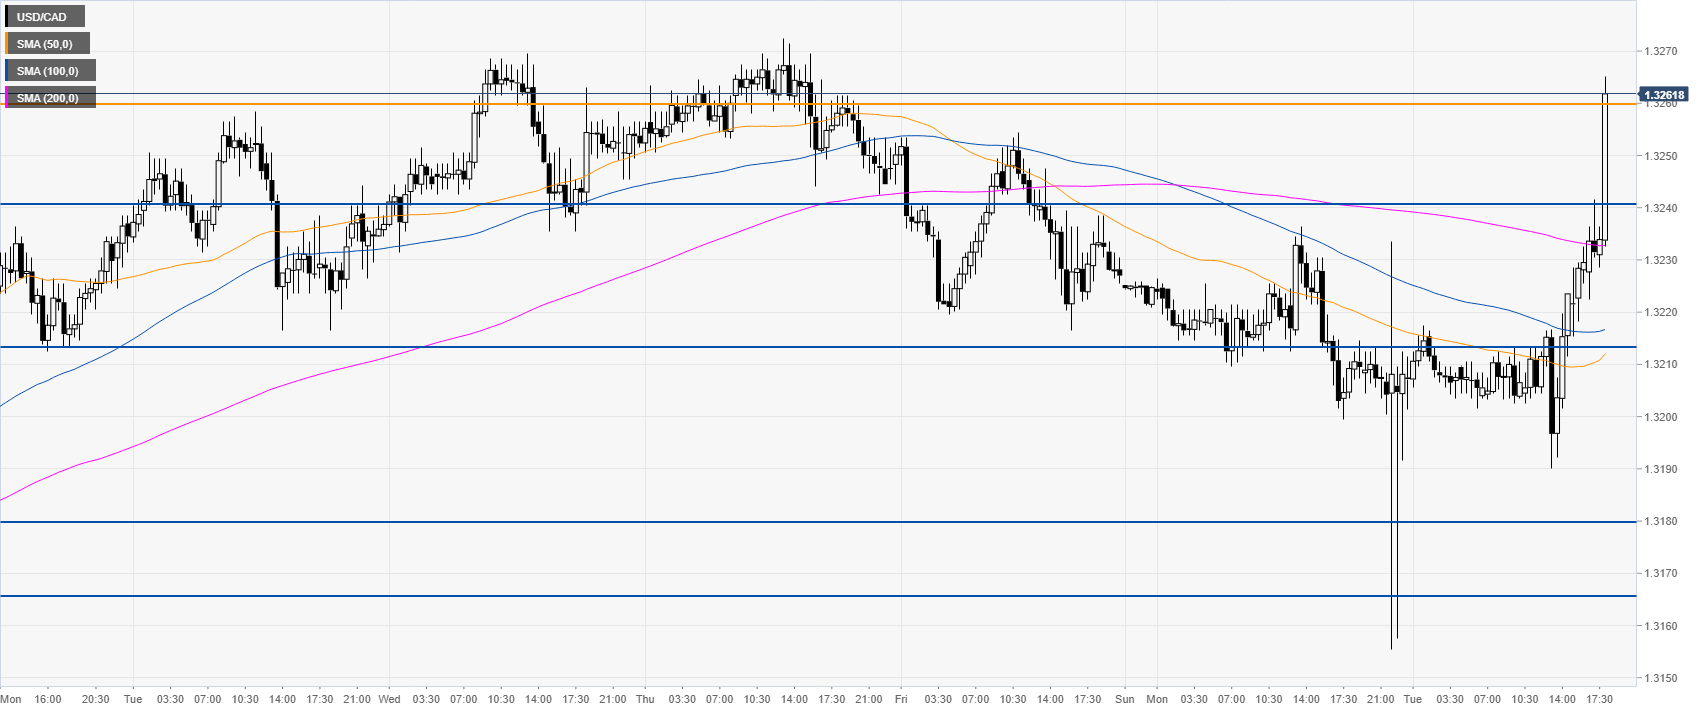
USD/CAD 30-minute chart
USD/CAD is trading above its main SMAs, suggesting a bullish momentum in the near term. Support is seen at the 1.3241, 1.3213 and 1.3180/65 price zone, according to the Technical Confluences Indicator.
Additional key levels
