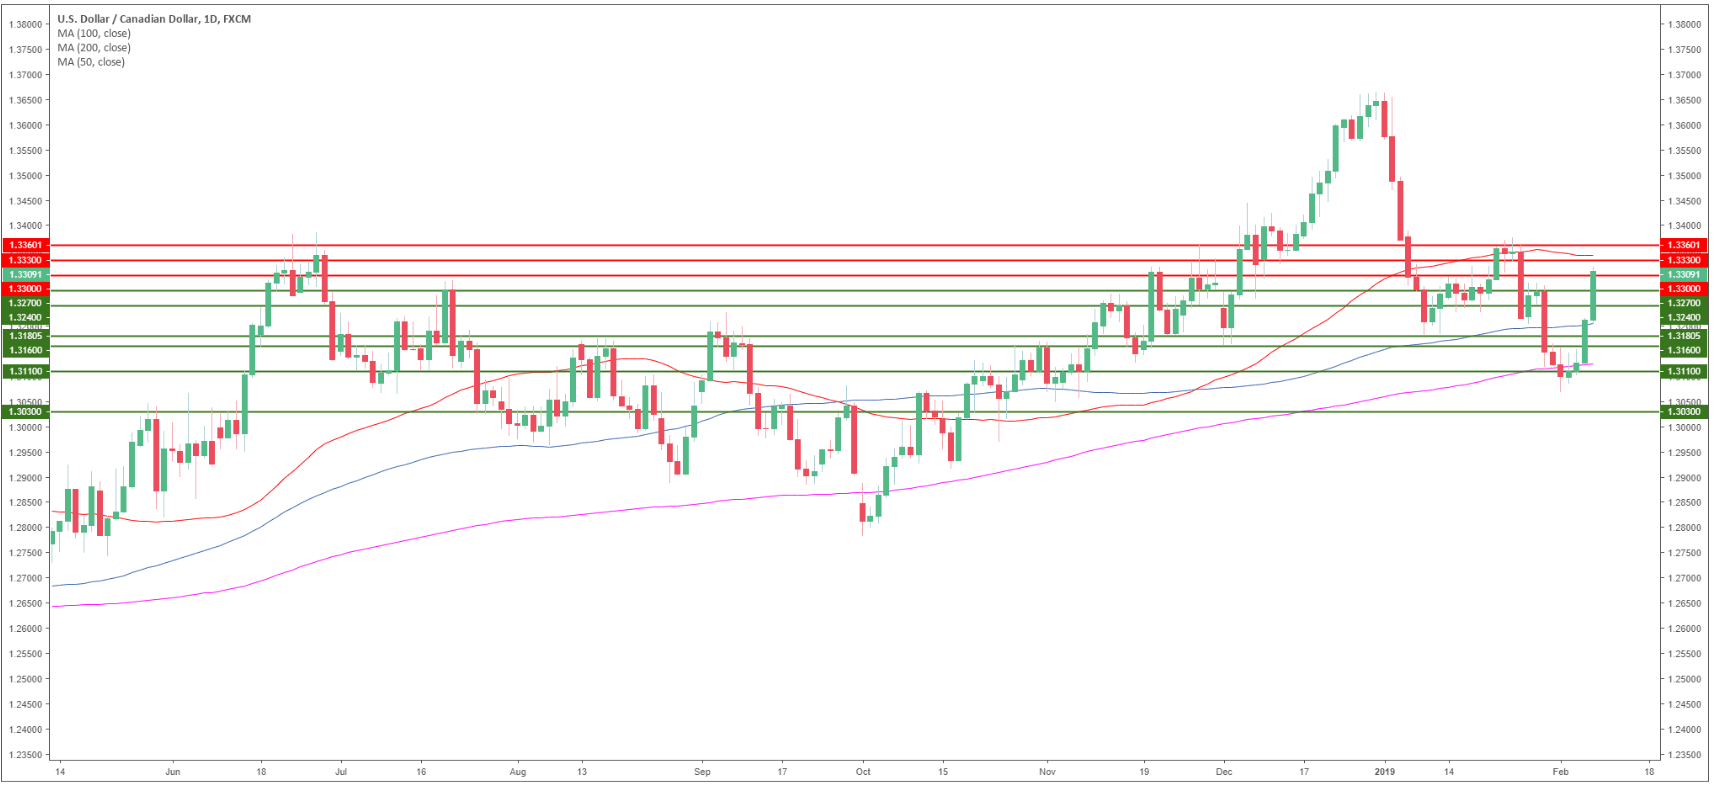
USD/CAD daily chart
- USD/CAD is trading in a bull trend above the 200-day simple moving average (SMA).
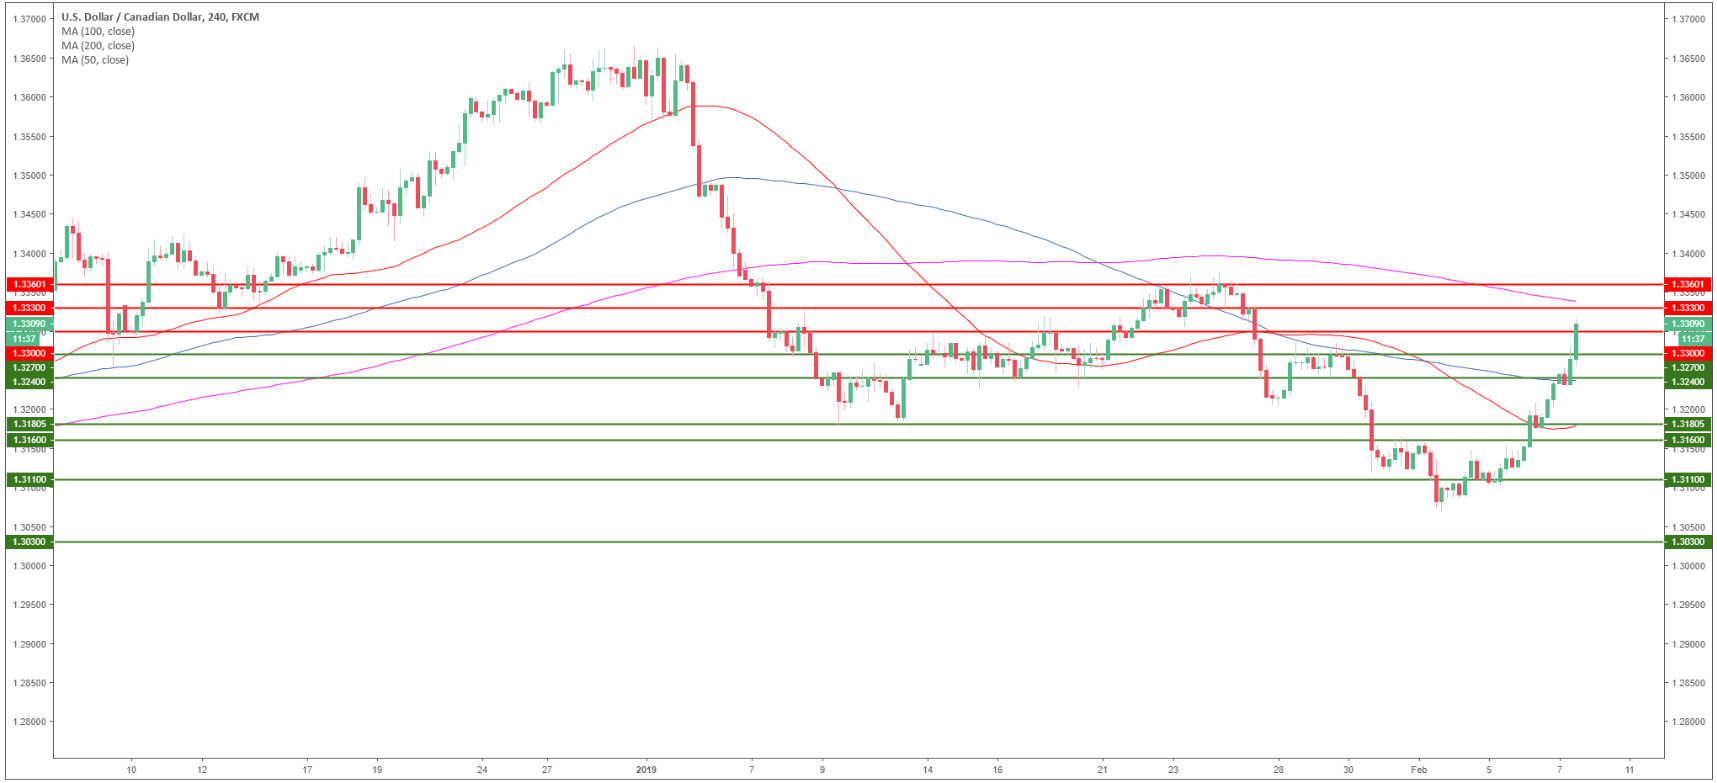
USD/CAD 4-hour chart
- USD/CAD is trading between the 100 and 200 SMAs suggesting sideways trading in the medium-term.
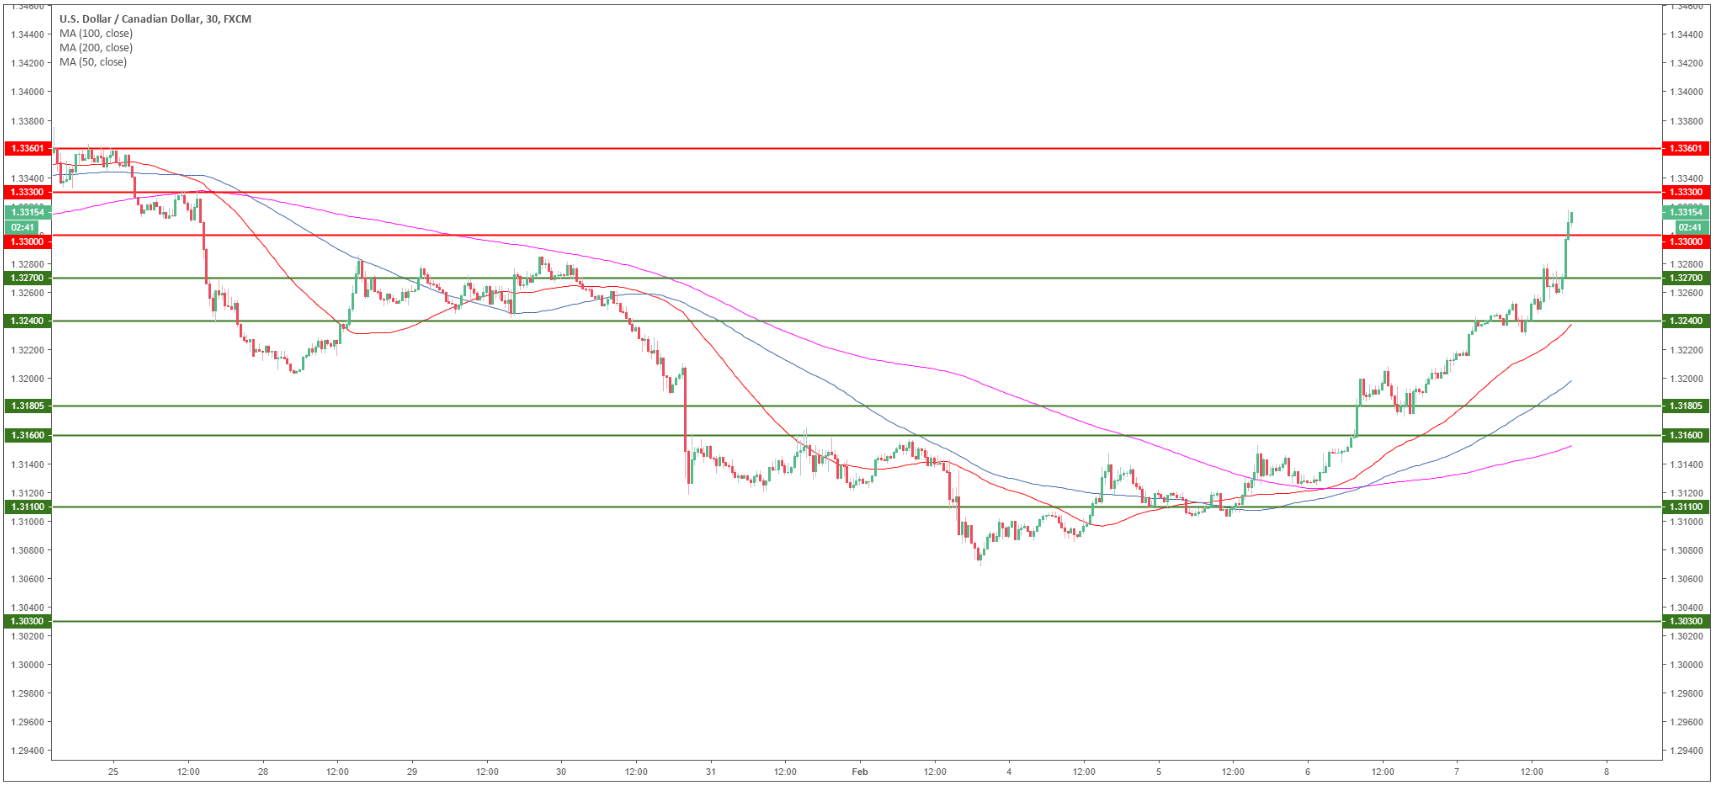
USD/CAD 30-minute chart
- USD/CAD is trading above its main SMAs suggesting bullish momentum in the near-term.
- The next levels to watch for to the upside are 1.3330 and 1.3360.
- On the way down, pullbacks can reach 1.3300, 1.3270 and 1.3240 levels.
Additional key levels
USD/CAD
Overview:
Today Last Price: 1.3309
Today Daily change: 105 pips
Today Daily change %: 0.80%
Today Daily Open: 1.3204
Trends:
Daily SMA20: 1.324
Daily SMA50: 1.3367
Daily SMA100: 1.3223
Daily SMA200: 1.3133
Levels:
Previous Daily High: 1.321
Previous Daily Low: 1.3124
Previous Weekly High: 1.3287
Previous Weekly Low: 1.3069
Previous Monthly High: 1.3664
Previous Monthly Low: 1.3118
Daily Fibonacci 38.2%: 1.3177
Daily Fibonacci 61.8%: 1.3157
Daily Pivot Point S1: 1.3149
Daily Pivot Point S2: 1.3094
Daily Pivot Point S3: 1.3064
Daily Pivot Point R1: 1.3234
Daily Pivot Point R2: 1.3264
Daily Pivot Point R3: 1.3319
