- USD/CAD is challenging levels not seen since October 2018.
- Sellers need a breakout below 1.3037 support.
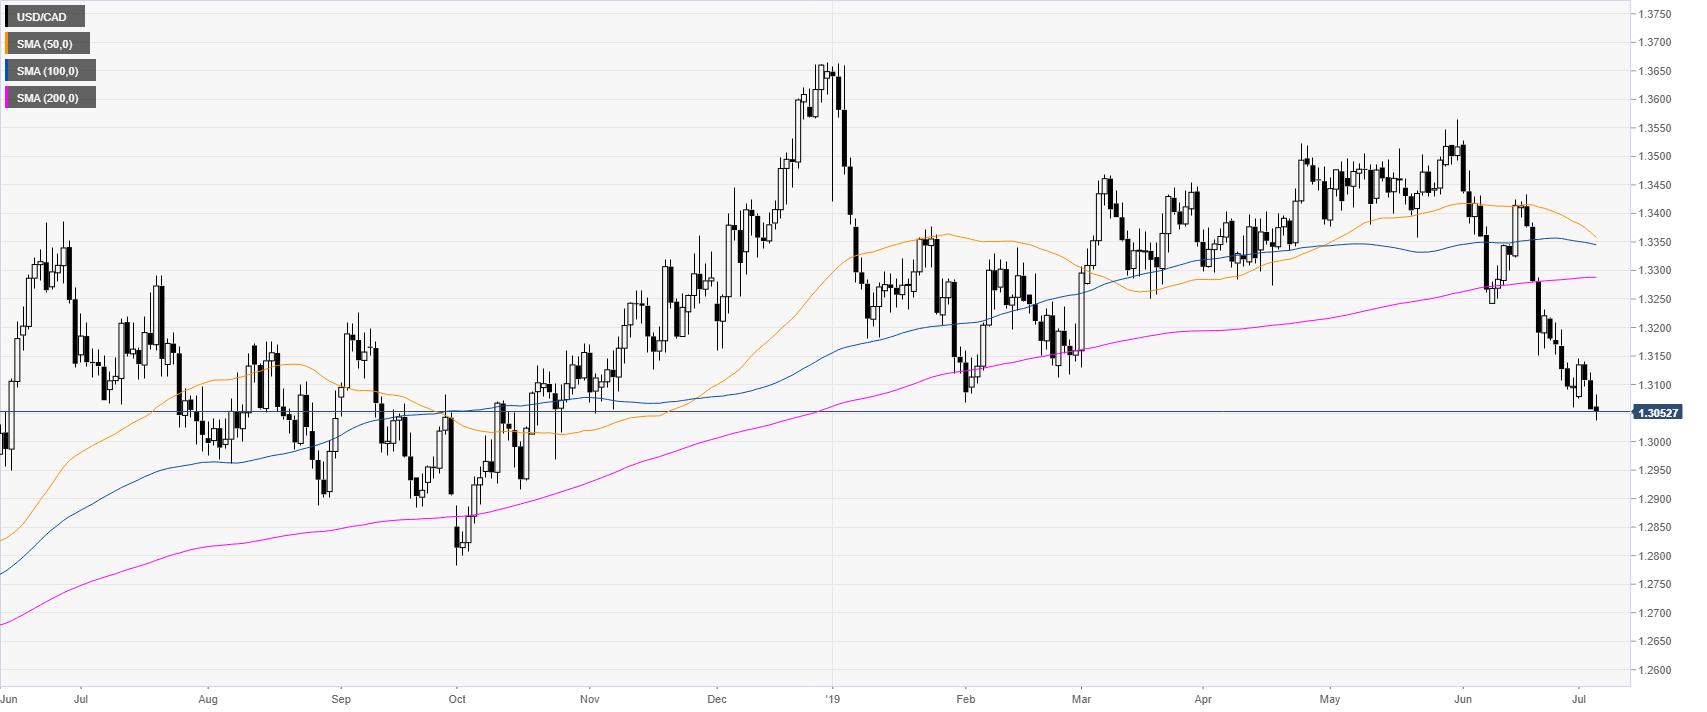
USD/CAD daily chart
USD/CAD is dropping to multi-month lows as the market is trading below its main daily simple moving averages (DSMAs).
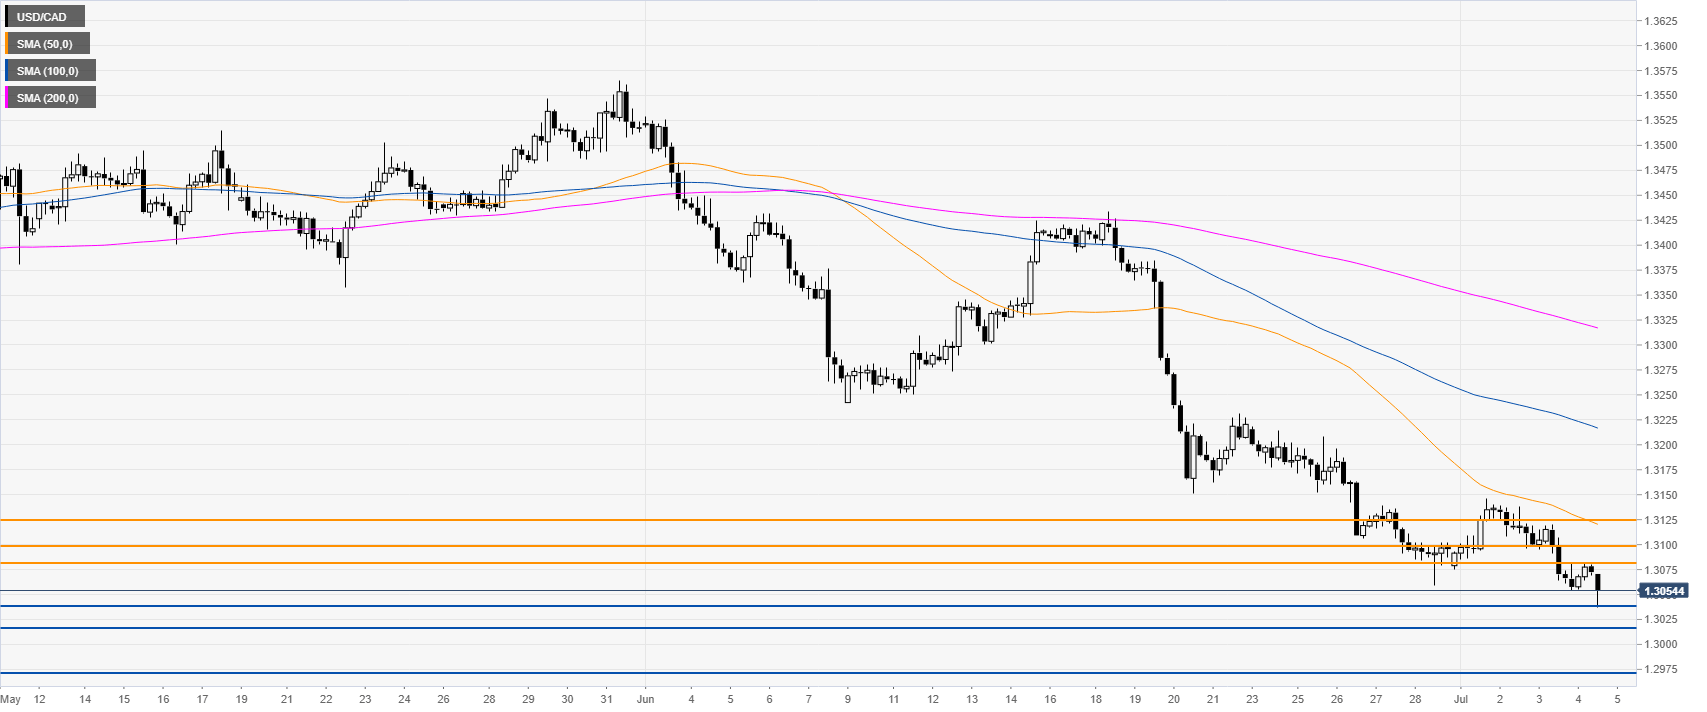
USD/CAD 4-hour chart
USD/CAD had a small reaction up above the 1.3037 support but remains under heavy bearish pressure below its main SMAs. If the market break below 1.3037 support, the next levels to the downside can be seen at 1.3016 and 1.2969.
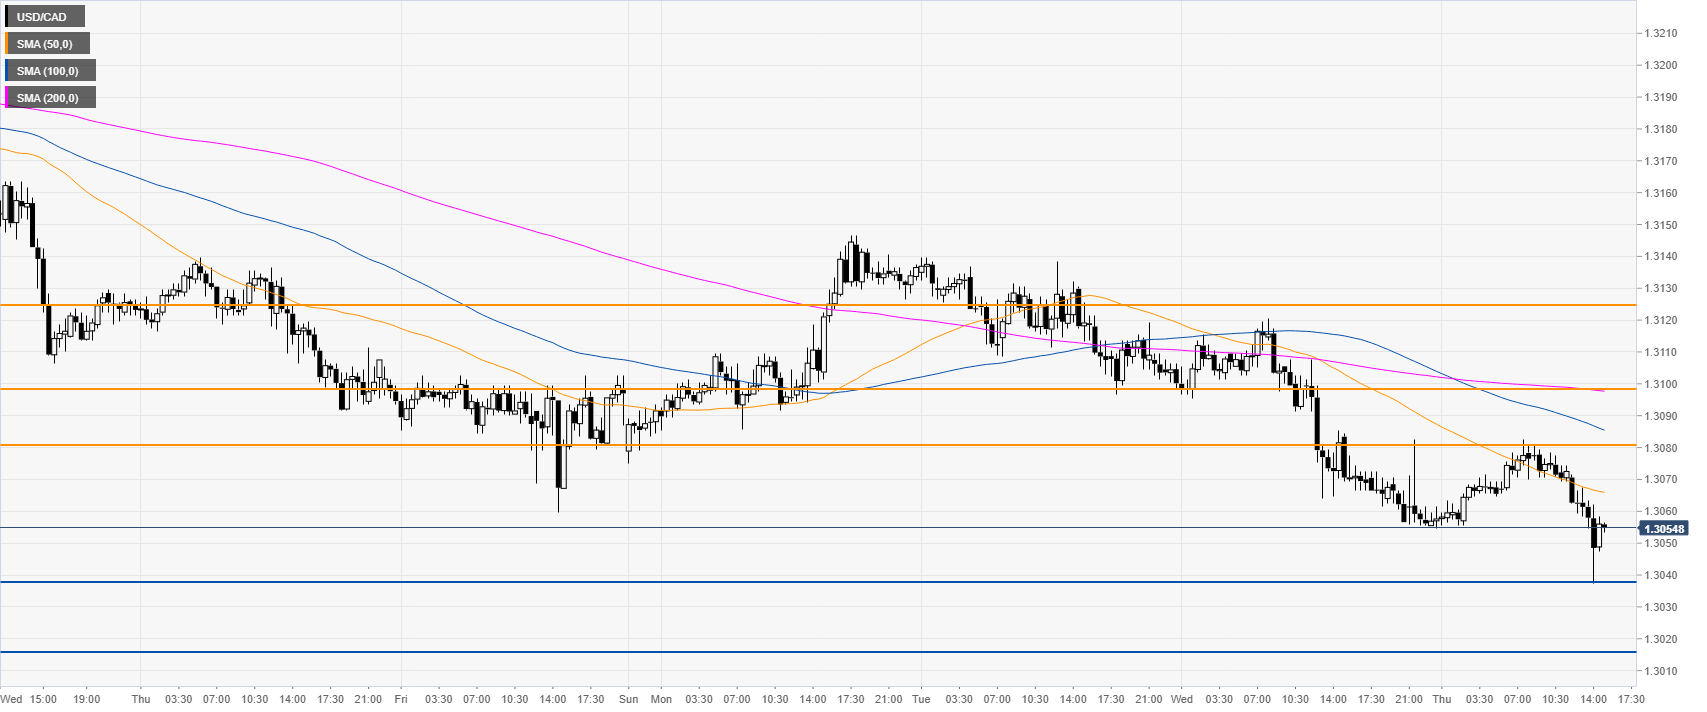
USD/CAD 30-minute chart
The market is trading below its main SMAs suggesting a bearish bias in the near term. Resistances can be seen at 1.3080, 1.3100 and 1.3125, according to the Technical Confluences Indicator.
Additional key levels
