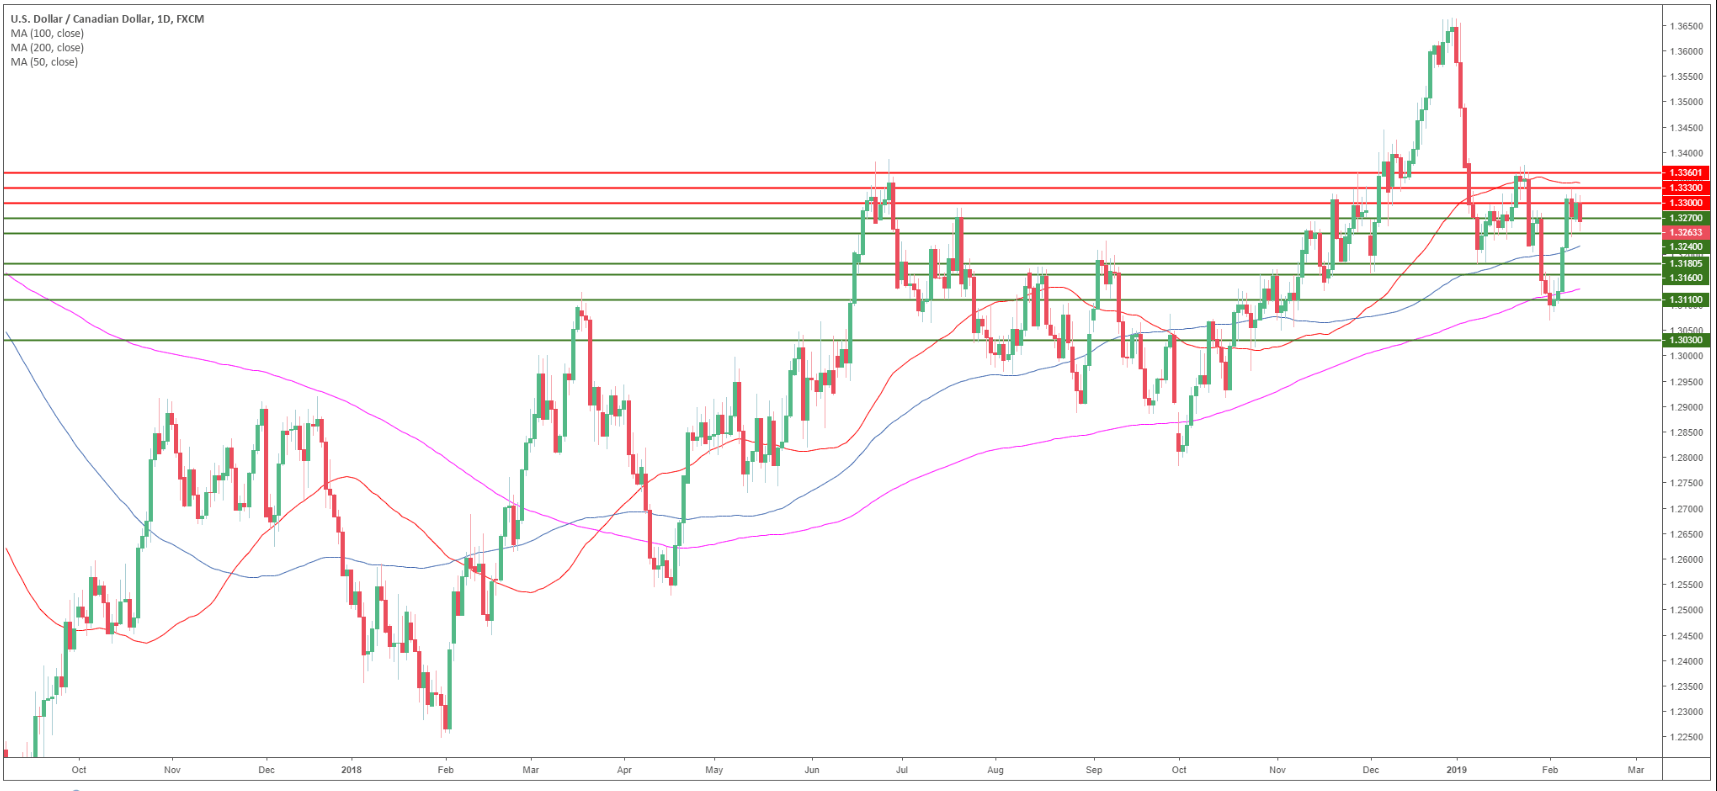
USD/CAD daily chart
- USD/CAD is trading in a bull trend above the 200-day simple moving average (SMA).
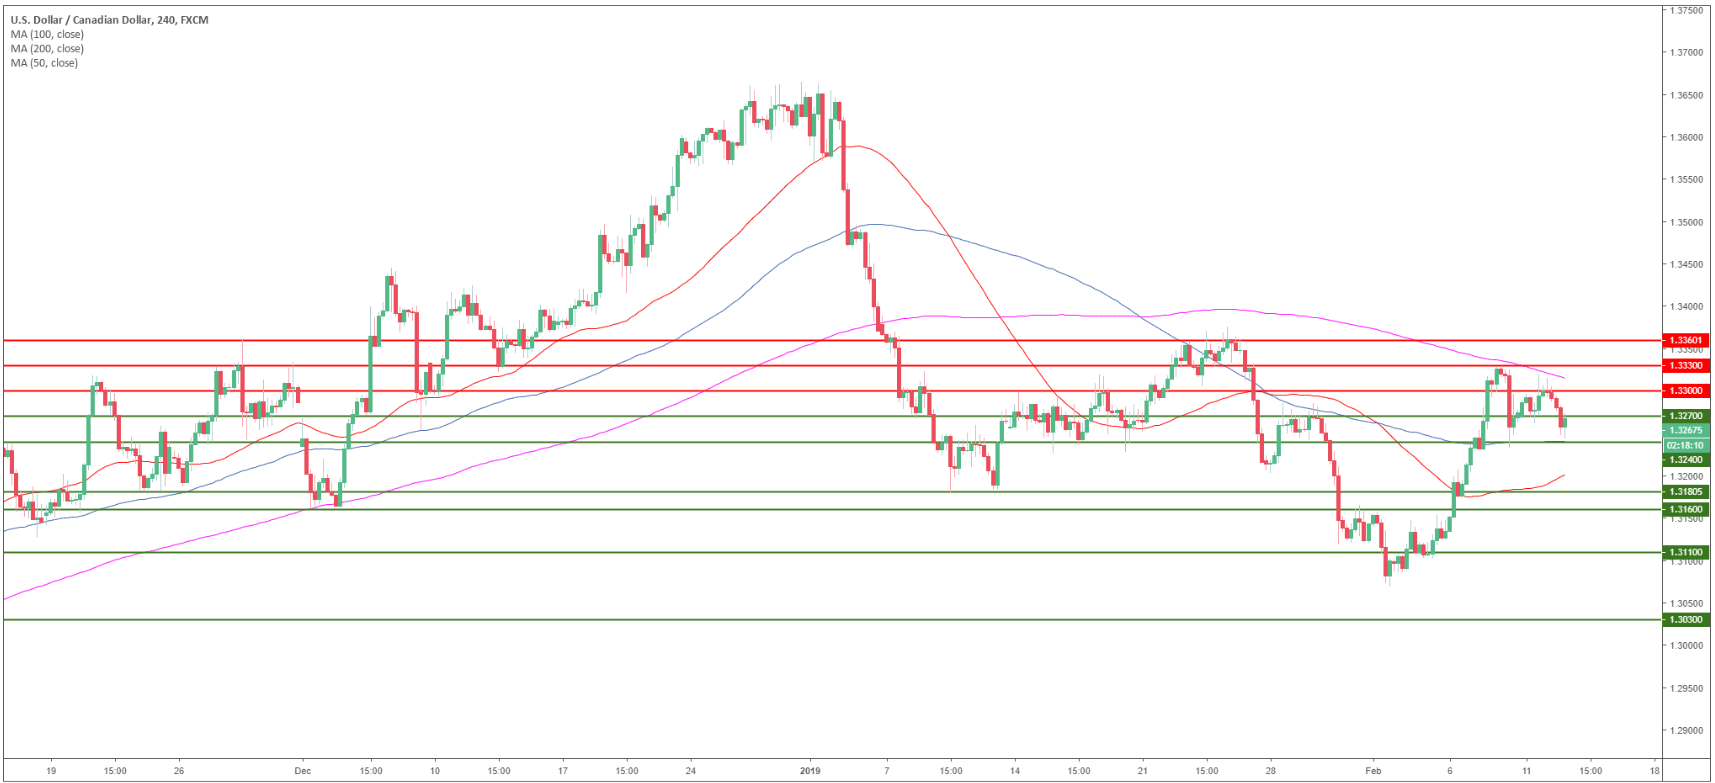
USD/CAD 4-hour chart
- USD/CAD is trading between the 100 and 200 SMA suggesting a sideways market in the medium-term.
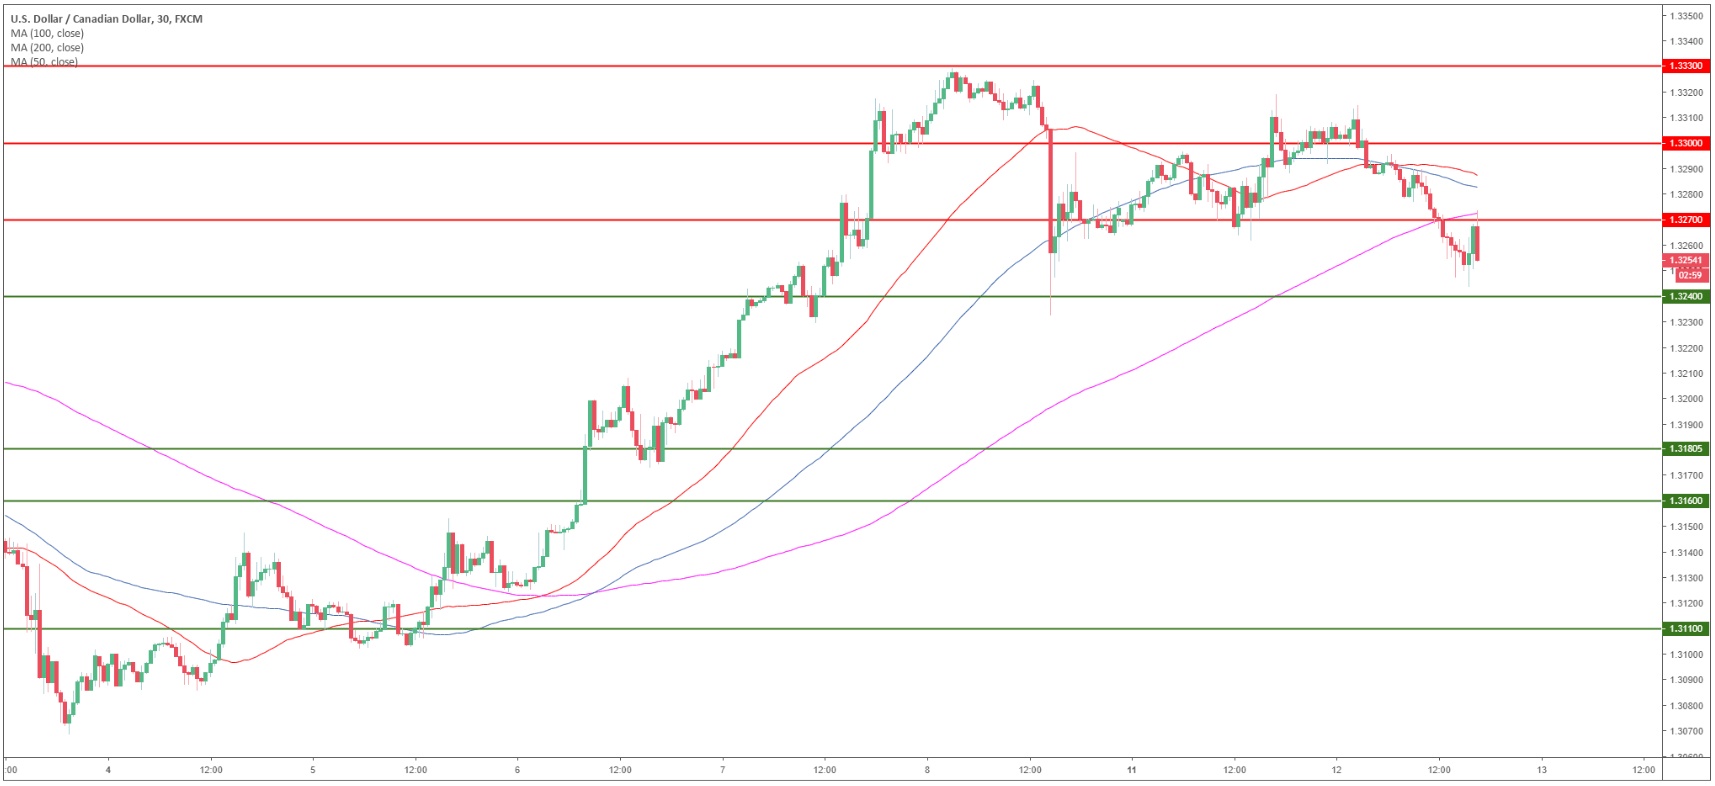
USD/CAD 30-minute chart
- USD/CAD is trading below its mains SMAs suggesting bearish momentum in the short-term.
- The 1.3240 support is the level to beat for bears.
- In the near-term, USD/CAD is seen evolving range-bound between 1.3240 and 1.3300 figure.
Additional key levels
USD/CAD
Overview:
Today Last Price: 1.3268
Today Daily change: -34 pips
Today Daily change %: -0.26%
Today Daily Open: 1.3302
Trends:
Daily SMA20: 1.3244
Daily SMA50: 1.3369
Daily SMA100: 1.3234
Daily SMA200: 1.314
Levels:
Previous Daily High: 1.332
Previous Daily Low: 1.3262
Previous Weekly High: 1.333
Previous Weekly Low: 1.3084
Previous Monthly High: 1.3664
Previous Monthly Low: 1.3118
Daily Fibonacci 38.2%: 1.3297
Daily Fibonacci 61.8%: 1.3284
Daily Pivot Point S1: 1.327
Daily Pivot Point S2: 1.3237
Daily Pivot Point S3: 1.3212
Daily Pivot Point R1: 1.3327
Daily Pivot Point R2: 1.3352
Daily Pivot Point R3: 1.3385
