- USD/CAD fails to extend latest pullback beyond key resistance-confluence.
- Three-week-old horizontal-line restricts immediate downside.
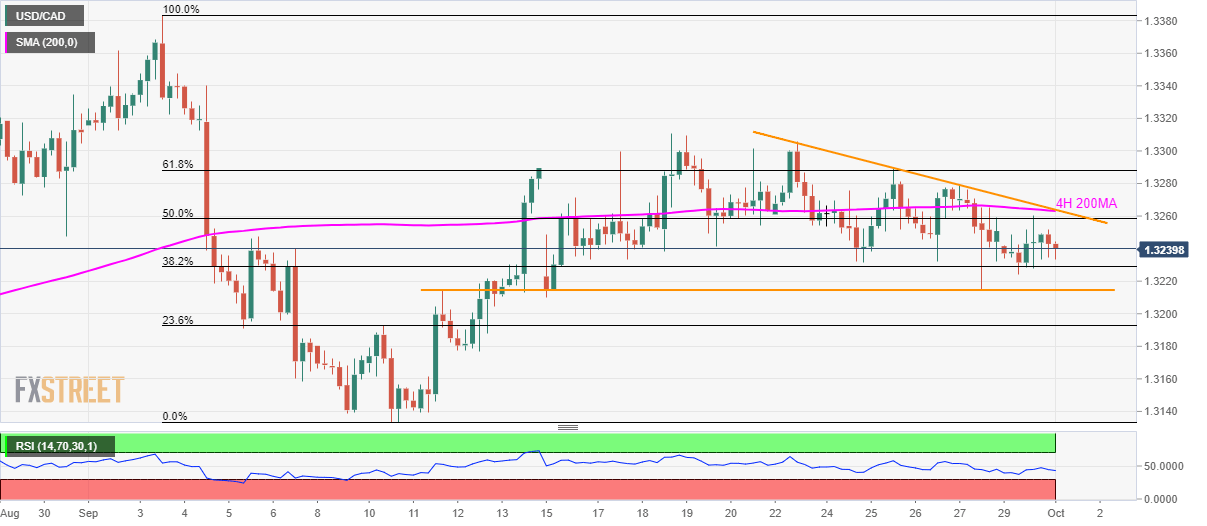
With its failure to cross 1.3263/65 resistance-confluence, USD/CAD drops back towards near-term horizontal support as it trades near 1.3240 during the Asian session on Tuesday.
The pair nears 1.3215/16 horizontal-support that comprises September 11 high and lows marked during September 16 and 27, a break of which could drag the quote further south to 23.6% Fibonacci retracement of the previous-month declines, close to 1.3190.
In a case where prices refrain from bouncing off 1.3190, 1.3155 and 1.3130 could be bears’ next targets.
Alternatively, a sustained break above 1.3263/65 area, including 200-bar simple moving average on the four-hour chart (4H 200MA) and one-week-old falling trend-line, could trigger pair’s fresh run-up to a fortnight high surrounding 1.3310.
Though, buyers will look for successful trading beyond 1.3330 to challenge 1.3385 and 1.3400 barriers to the north.
USD/CAD 4-hour chart
Trend: bearish
