“¢ The pair has been steadily climbing alongside a short-term ascending trend-channel formation on the 1-hourly chart since the early North-American session on Friday.
“¢ The positive momentum stalled near the trend-channel resistance, also coinciding with 200-hour SMA amid a fresh wave of broad-based USD selling pressure.
“¢ Considering the pair’s recent decline, the ascending channel seems to constitute towards a bearish flag chart pattern formation on the mentioned chart.
“¢ Moreover, technical indicators on the daily chart are still far from oversold but are yet to recover from the negative territory and add credence to the bearish outlook.
“¢ Hence, the ongoing recovery momentum might still be seen as corrective in nature and runs the risk of facing fresh supply on every attempted up-move.
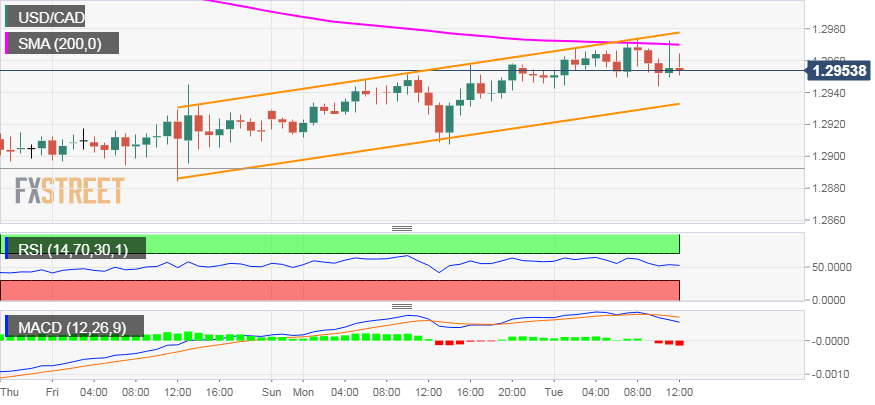
Spot Rate: 1.2954
Daily High: 1.2973
Daily Low: 1.2945
Trend: Bullish
Resistance
R1: 1.2973 (current day swing high)
R2: 1.3000 (psychological mark)
R3: 1.3026 (R3 daily pivot-point)
Support
S1: 1.2924 (S1 daily pivot-point)
S2: 1.2900 (round figure mark)
S3: 1.2863 (200-day SMA)
