- USD/CAD turns choppy inside a five-week-old rising channel.
- Near overbought RSI conditions likely dragging prices if 200-DMA breaks.
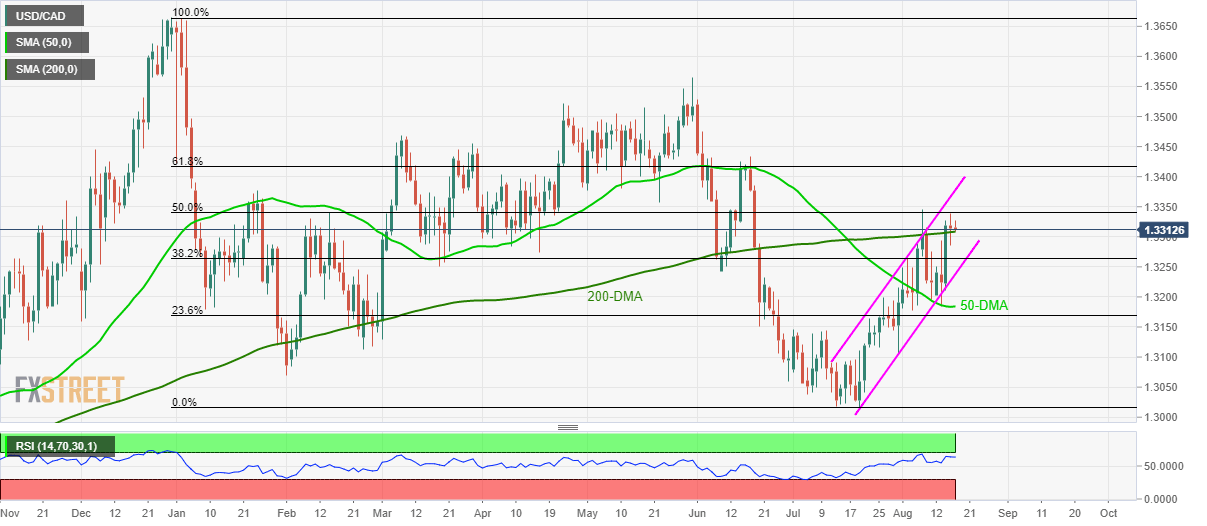
Despite registering another failure to rise past 50% Fibonacci retracement of December 2018 to July 219 declines, USD/CAD trades modestly unchanged to 1.3315 during early Friday.
The reason seems strong support provided by 200-day simple moving average (DMA) around 1.3305/10.
However, near overbought conditions of 14-bar relative strength index (RSI) increases the odds for the pair’s dip to 38.2% Fibonacci retracement level of 1.3263 but channel-support close to 1.3240 will limit further weakness.
If prices refrain to respect 1.3240, 50-DMA level of 1.3185 will be in the spotlight.
Meanwhile, an upside clearance of 1.3340 comprising 50% Fibonacci retracement can propel the quote to channel-resistance of 1.3380.
USD/CAD daily chart
Trend: Pullback expected
