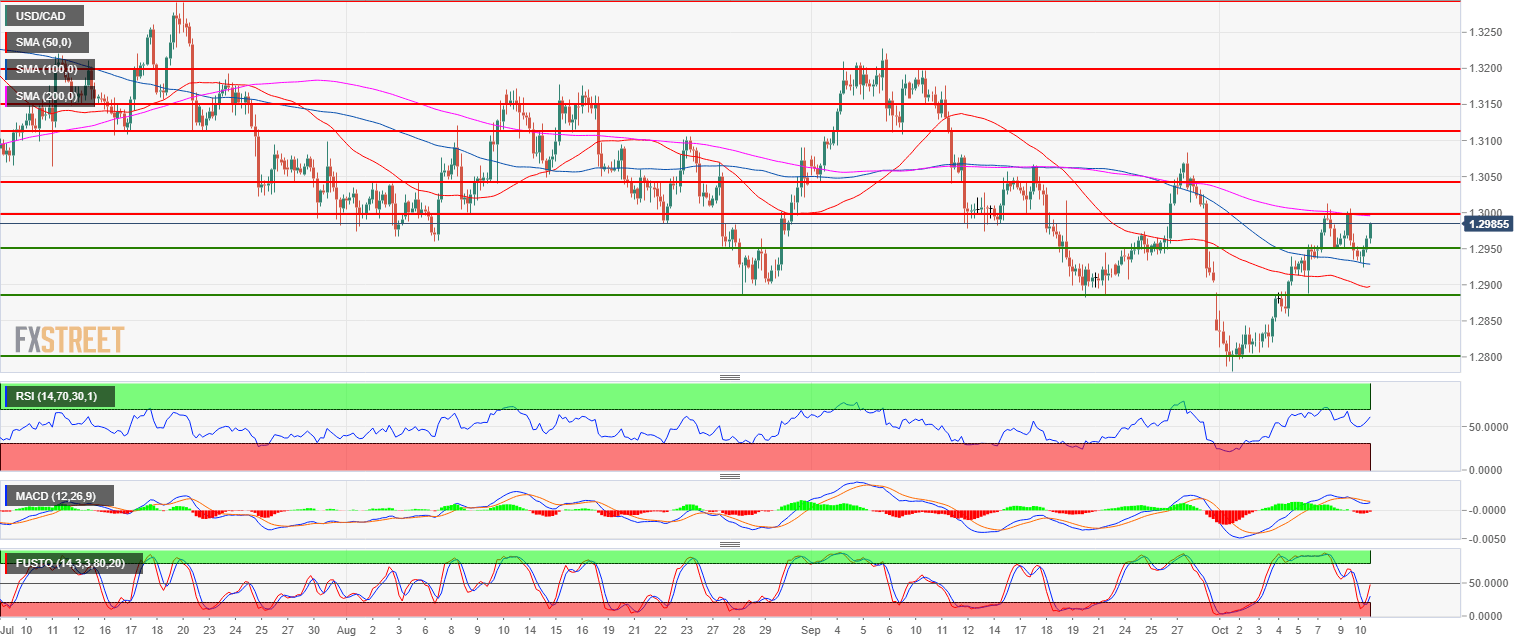
- USD/CAD bull leg is losing momentum as it is finding resistance near the 1.3000 figure and the 200-period simple moving average on the 4-hour chart.
- A breakout below 1.2950 should initially target 1.2900 figure and then 1.2800 if the bears can gain some more traction.
- A bull breakout above 1.3000 would invalidate the bearish bias.
Spot rate: 1.2987
Relative change: 0.34%
High: 1.2988
Low: 1.2926
Main trend: Neutral
Resistance 1: 1.3000 figure
Resistance 3: 1.3048 August 14 low
Resistance 4: 1.3108, September 7 low
Resistance 5: 13200 figure
Support 1: 1.2950-59 multi-month resistance and August 7 low
Support 2: 1.2882-1.2900 September 20 low and figure
Support 3: 1.2855-65 June 6 low – 200-day SMA
Support 4: 1.2800 figure
Support 5: 1.2727 May 11 low
