Home USD/CAD Technical Analysis: USD/CAD drops below 1.2950 level – Bulls might support the market above 1.2900 figure
FXStreet News

USD/CAD Technical Analysis: USD/CAD drops below 1.2950 level – Bulls might support the market above 1.2900 figure

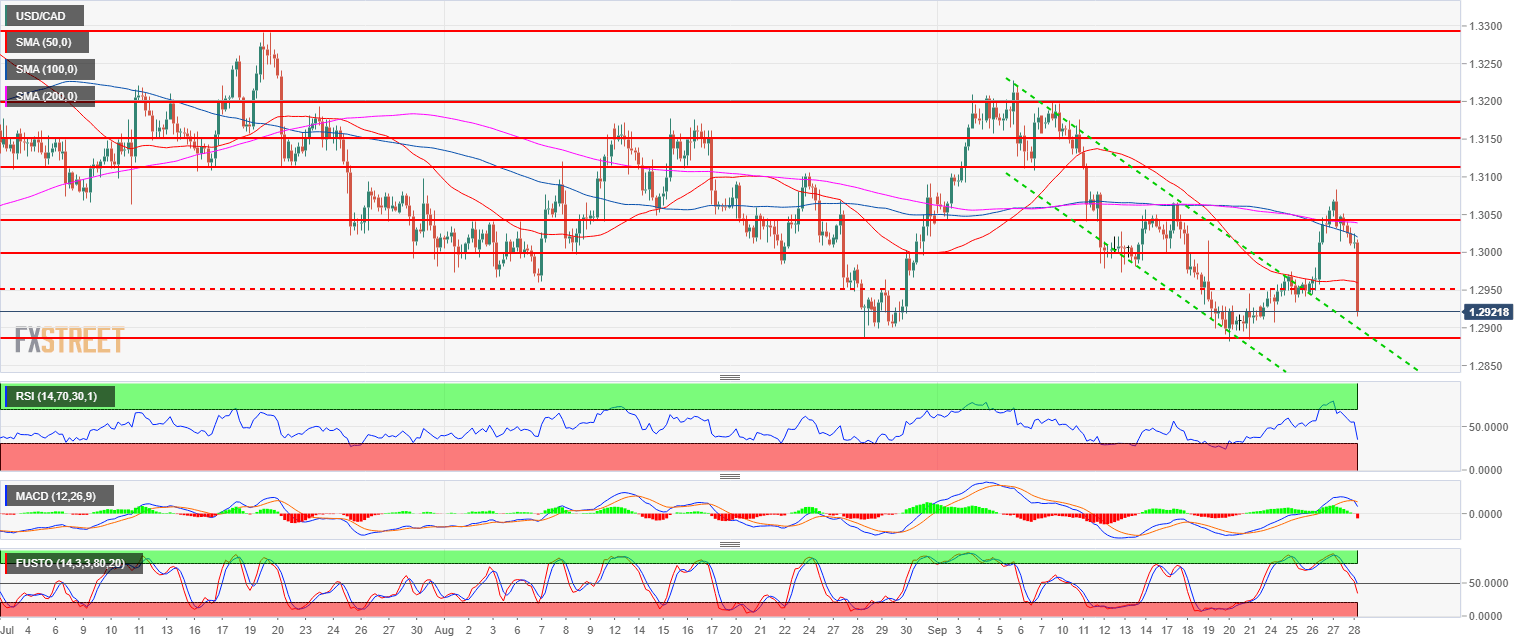
  • USD/CAD main bull trend is on hold as the bears are driving the market towards 1.2900 figure.  
  • USD/CAD is trading below its 50, 100 and 200-period simple moving average while the RSI, MACD and Stochastics are in negative territories.
  • However, bears will need a convincing breakout below 1.2882 (September 20 low) in order to shift the bias to strong bearish.    

USD/CAD 4-hour chart

Spot rate:                   1.2923
Relative change:        0.92%  
High:                          1.3051
Low:                           1.2909

Main trend:                Bullish  

Resistance 1:            1.2959 August 7 low
Resistance 2:            1.3000 figure
Resistance 3:            1.3048 August 14 low
Resistance 4:            1.3108, September 7 low
Resistance 5:            13200 figure
 
Support 1:                 1.2882 September 20 low
Support 2:                 1.2855-65 June 6 low – 200-day SMA
Support 3:                 1.2800 figure

FX Street

FX Street

FXStreet is the leading independent portal dedicated to the Foreign Exchange (Forex) market. It was launched in 2000 and the portal has always been proud of their unyielding commitment to provide objective and unbiased information, to enable their users to take better and more confident decisions.