- CAD bulls defended long-term trendline on hawkish BOE.
- Long-term bullish breakout remains elusive.
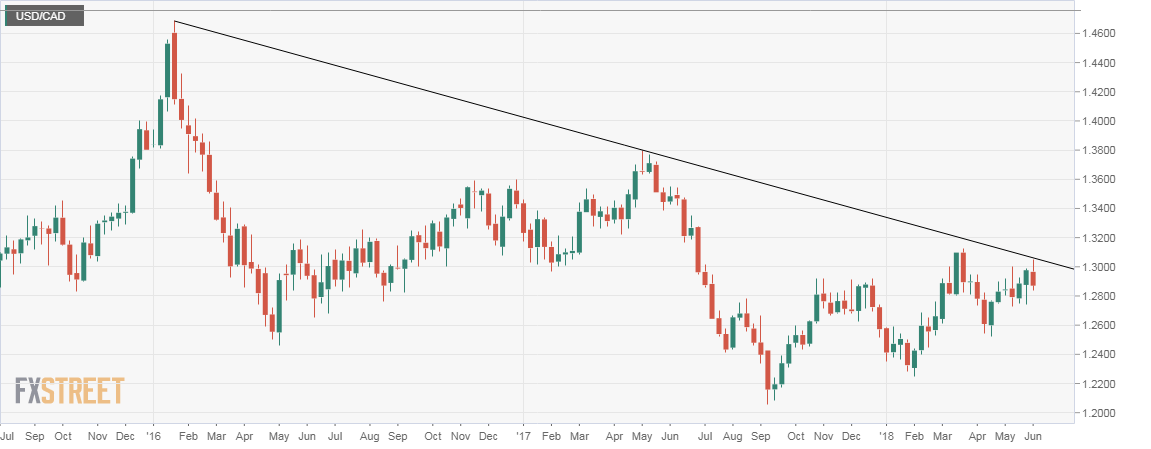
Weekly chart
Spot rate: 1.2870
Weekly high: 1.3047
Weekly low: 1.2836
Trend: Bullish invalidation confirmed
Resistance
1.2892 (10-day moving average)
1.30 (psychological hurdle)
1.3047 (May 29 high)
Support
1.2810 (50-day moving average)
1.2803 (May 2 low)
1.2728 (100-day moving average)
The USD/CAD pair failed to take out the long-term falling trendline, sloping downwards from the January 2016 low and April 29 low yesterday and closed well below 1.2943 (April 2 high), signaling bullish invalidation, i.e. rally from the January low of 1.2247 has ended.
The bull failure could be associated with the Bank of Canada’s hawkish monetary policy statement released yesterday. The central bank kept rates unchanged as expected, but kept the doors open for a near-term rate rise.
