- USD/CHF buyers attack the upper end of 0.9452-60 trading range.
- Immediate horizontal resistance, 100/200-HMA tames upbeat break of three-day-old resistance line, now support.
- 0.9420 acts as additional support before June month’s low, chart pattern suggest sideways moves to continue.
USD/CHF takes the bids around 0.9460, up 0.07% on a day, while heading into the European session on Friday. The quote keeps the upside break of a descending trend line from June 30. However, an immediate horizontal resistance line guards the pair’s rise around 0.9465.
Other than the 0.9465 upside barrier, 100 and 200 HMAs around 0.9470-75 could also challenge the quote’s advances, a break of which will refresh the monthly top around 0.9500.
Assuming the pair’s sustained trading beyond 0.9500, 0.9530 and June 12 high close to 0.9555 will become the bulls’ favorites.
On the flip side, the resistance-turned-support around 0.9435 can stop further selling of the pair below the intraday range of 0.9452-60.
Though, buyers’ inability to return past-0.9435 may not hesitate to challenge the weekly bottom of 0.9425 and attack June 23 low of 0.9420 to aim for a further downside below the 0.9400 threshold.
USD/CHF hourly chart
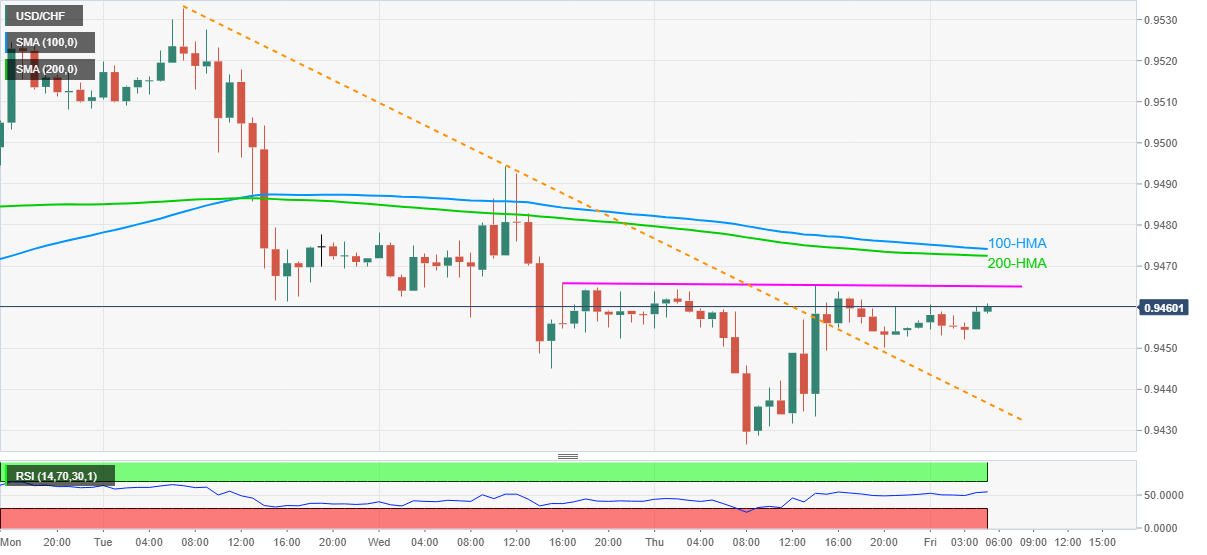
Trend: Sideways
