- USD/CHF extends losses from 0.9508 following the pullback from a four-week-old resistance line.
- June 12 top, key Fibonacci retracements add upside barriers.
- The triangle’s downside break can refresh monthly low.
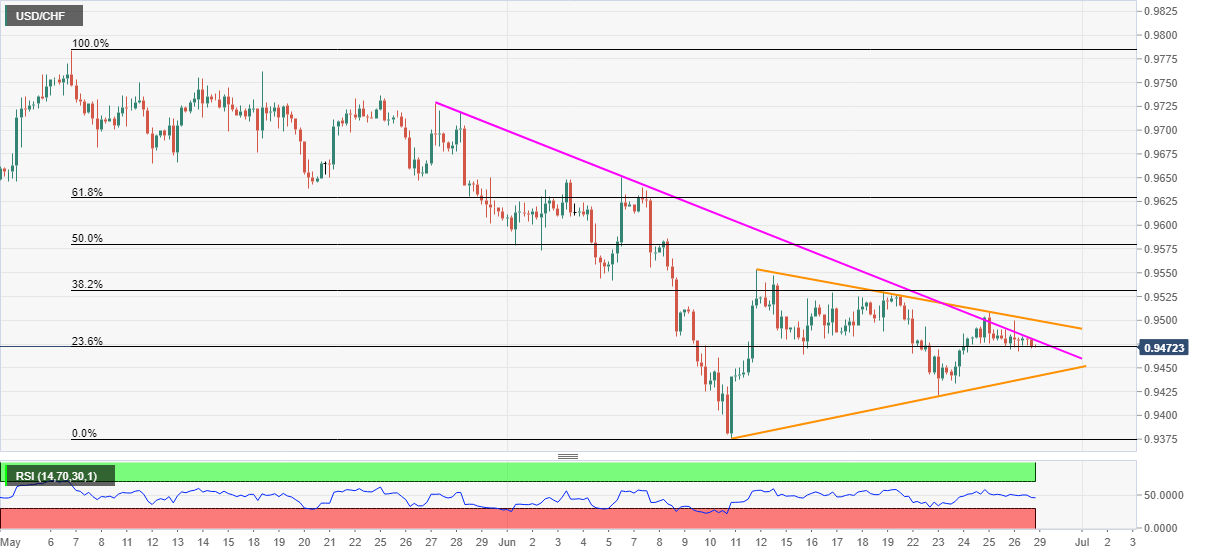
USD/CHF dwindles to 0.9470, down 0.10% on a day, during the pre-European session on Monday. The pair recently took a U-turn from a descending trend line from May 27. Before that, the quote reversed from the resistance line of a short-term symmetrical triangle formation.
In both the cases, the pair is likely to extend weakness towards the said triangle pair’s support, at 0.9440 now. However, a clear downside break will need validation from June 23 low near 0.9420 before attacking the monthly bottom surrounding 0.9375.
During the pair’s further rule after 0.9375, 0.9320 and 0.9270 could entertain the bears ahead of highlighting the yearly bottom surrounding 0.9180 on the sellers’ radar.
Alternatively, 0.9480 mark comprising the monthly resistance can guard the pair’s nearby recovery moves ahead of the triangle’s upper line, currently around 0.9500.
Also acting as upside barriers could be the June 12 high and 50% Fibonacci retracement level of May-June fall, respectively around 0.9555 and 0.9580.
USD/CHF four-hour chart
Trend: Further weakness expected
