- USD/CHF trades successfully above 21-day SMA, 23.6% Fibonacci retracement.
- Positive oscillators favor further upside, 0.9832/37 can stop buyers beyond 50-day SMA.
- 0.9600 will gain the bear’s attention below the monthly bottom.
USD/CHF takes the bids to 0.9740, following an intra-day high of 0.9744, amid the initial trading session on Wednesday. The pair recently crossed 21-day SMA and 23.6% Fibonacci retracement of its October 2019 to January 16, 2020 low. If the same is looked in conjunction with the price-positive oscillators like MACD and RSI, the current recovery is likely to extend.
In doing so, January 10 top of 0.9763 and 38.2% Fibonacci retracement near 0.9771 can offer immediate resistance ahead of highlighting a 50-day SMA level of 0.9791.
If at all bulls remain interested beyond 0.9791, an area comprising October 2019 low and multiple tops marked during late-December 2019, around 0.9832/37 could return to the charts.
Alternatively, pair’s declines below 23.6% Fibonacci retracement and 21-day SMA, respectively near 0.9710 and 0.9698, can push the bears towards 0.9660 and the monthly low of 0.9613.
During the quote’s extended south-run past-0.9613, 0.9600 will be in focus.
USD/CHF daily chart
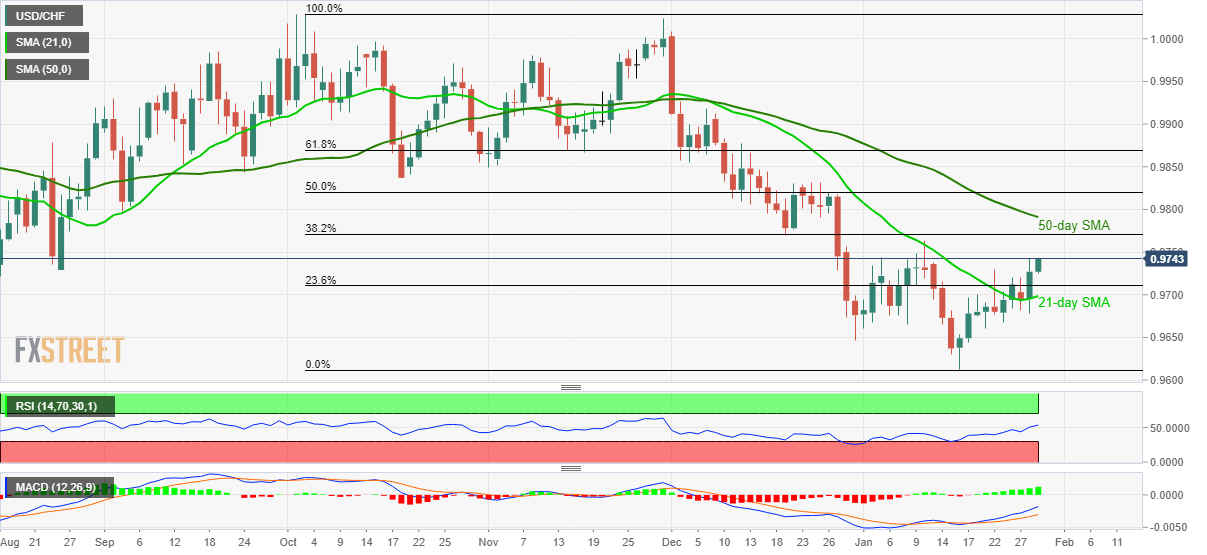
Trend: Recovery expected
