- USD/CHF slips below 0.9100 after failing to keep Monday’s recovery moves from 0.9087.
- A bullish chart pattern can take clues from an upbeat MACD histogram.
- Bears may target the mid-September bottom ahead of the August low.
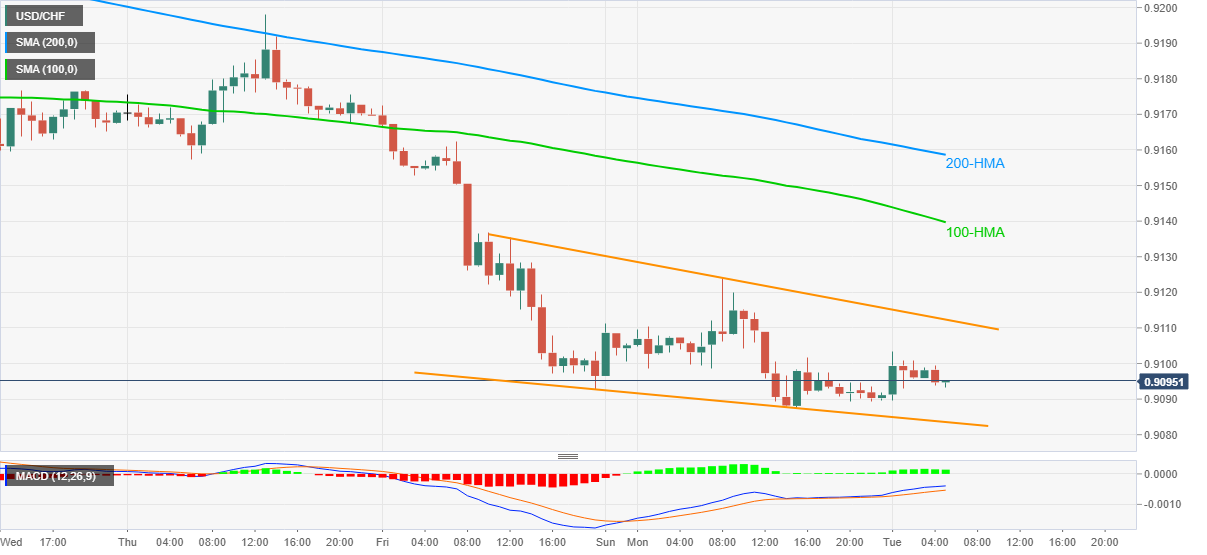
USD/CHF eases the upside momentum while declining to 0.9093 during the pre-European trading on Tuesday. Even so, bullish MACD and falling wedge on the hourly chart keeps the pair buyers hopeful.
As a result, a clear break of the 0.9115 resistance will confirm the quote’s upside towards 100 and 200-HMAs, respectively near 0.9140 and 0.9160.
In a case where the USD/CHF bulls remain in command past-0.9160, Thursday’s high near 0.9200 will become their favorite.
Meanwhile, a downside break of the pattern’s support line, at 0.9083 now, will direct the sellers towards 0.9050 surrounding the mid-September lows.
Though, any more downside by the USD/CHF prices below 0.9050 will make it vulnerable to attack the 0.9000 psychological magnet.
USD/CHF hourly chart
Trend: Pullback expected
