- USD/CHF remains pressured below 0.9537, still in the range between 0.9510 and 0.9520.
- A confluence of 10-day SMA, 50% Fibonacci retracement guard the pair’s immediate upside.
- Bears will attack the monthly low on the downside break below the key Fibonacci retracement.
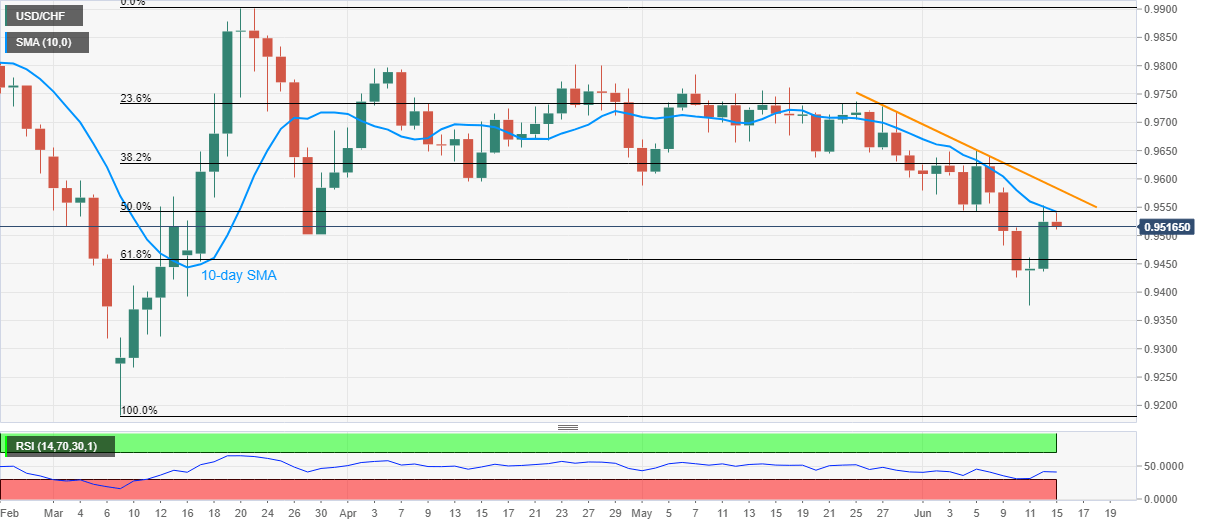
USD/CHF seesaws in a choppy range between 0.9510 and 0.9520, currently around 0.9516, amid the early Monday’s trading. Even so, the pair carries its pullback moves from 10-day SMA and 50% Fibonacci retracement of March month upside.
As a result, the sellers are expecting the quote’s further weakness towards a 61.8% Fibonacci retracement level of 0.9457. However, the pair’s further downside will make it vulnerable to challenge the monthly low surrounding 0.9375.
In doing so, the March 09 top near 0.9320 and the March month’s low of 0.9183 could lure the sellers.
Alternatively, a daily closing beyond 0.9545 resistance confluence could trigger the pair’s recovery moves towards a short-term falling trend line from May 27, near 0.9585 now.
If at all the pair buyers manage to sneak in above 0.9585, the monthly top near 0.9650 will be on their radars.
USD/CHF daily chart
Trend: Pullback expected
