- USD/CHF takes a U-turn from the short-term triangle resistance near 0.9050.
- Sustained trading below 200-HMA, normal RSI keep the bears hopeful.
- Bulls need a fresh monthly high for conviction.
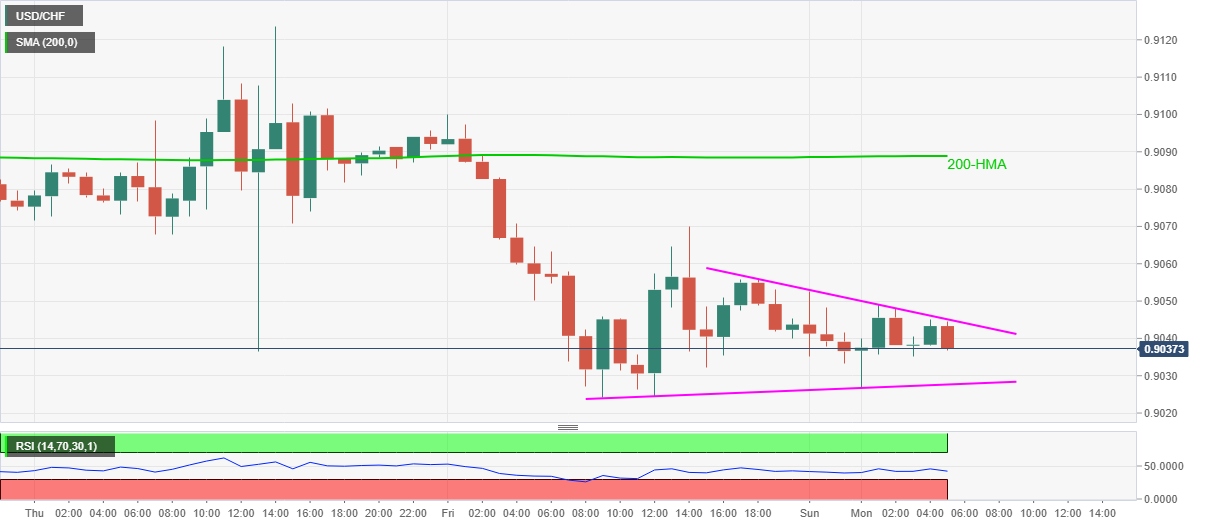
USD/CHF recedes to 0.9039 while heading into the European session on Monday. Even so, the pair trades inside a symmetrical triangle getting support and resistance line from August 28.
Considering the normal RSI conditions, as well as the pair’s declines below 200-HMA, the quote is likely to remain weak with the formation’s support of 0.9027 acting as immediate rest-point during further weakness.
It should, additionally, be noted that the 0.9000 threshold may question the sellers past-0.9027, which if ignored can divert the moves to January 20, 2015 top near 0.8840.
Meanwhile, an upside clearance of the triangle’s resistance, at 0.9045 now, will challenge a 200-HMA level of 0.9088 before attacking the previous week’s tops near 0.9130.
Though, the buyers aren’t expected to be convinced unless the pair refreshes the monthly high above 0.9242.
USD/CHF hourly chart
Trend: Sideways
