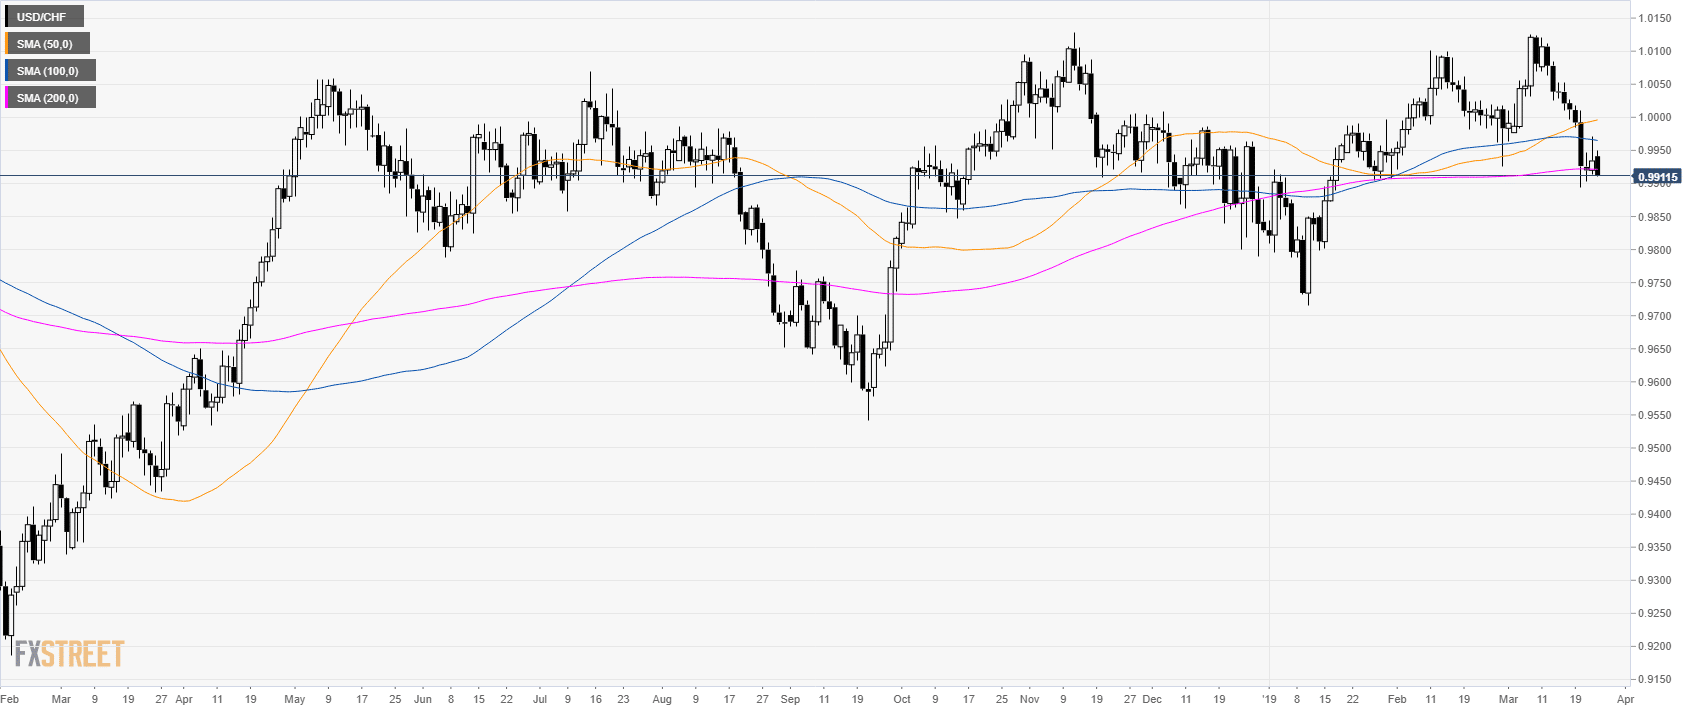
USD/CHF daily chart
- USD/CHF is trading in a sideways trend just above the 0.9900 level.
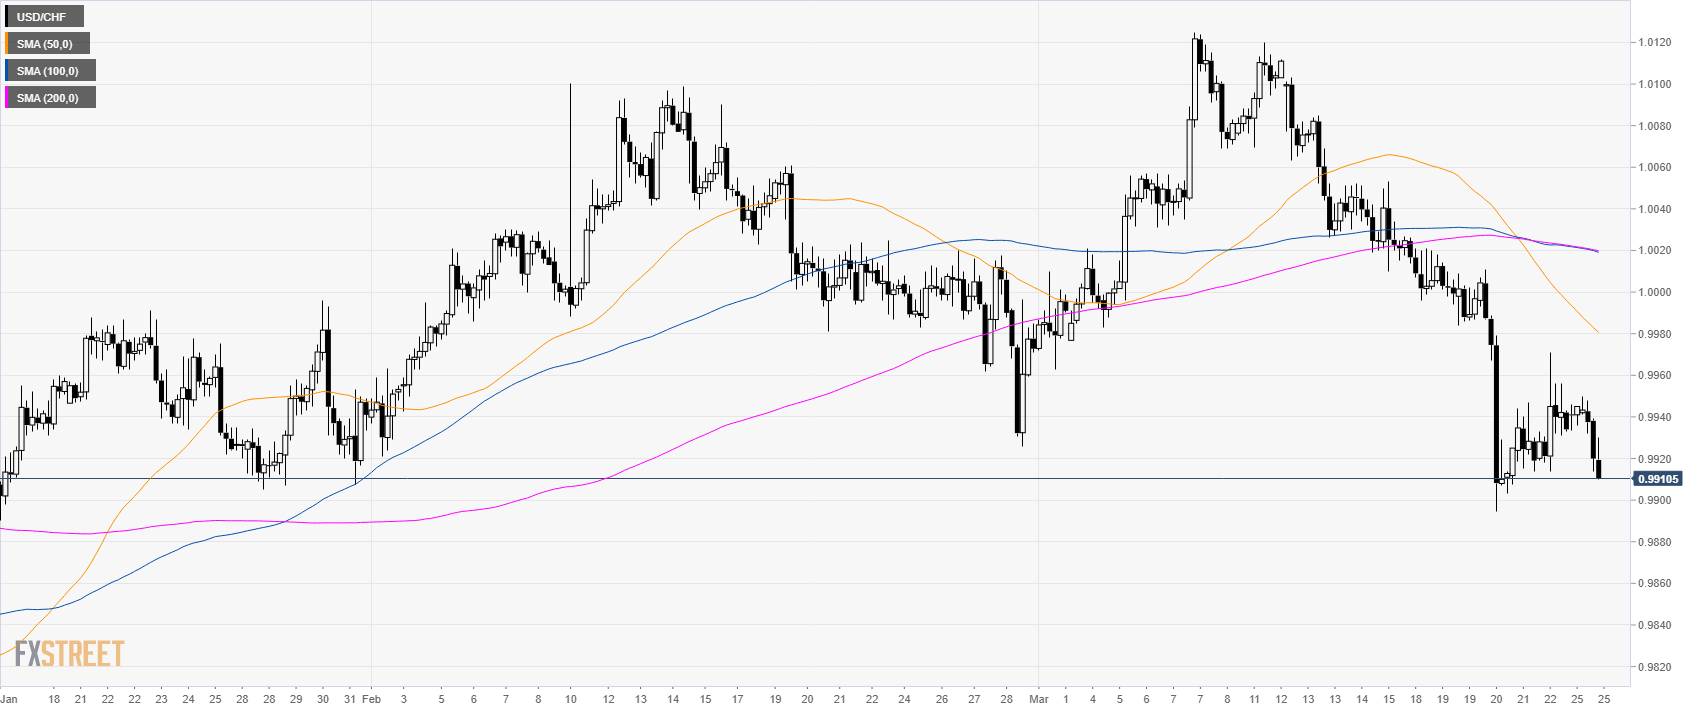
USD/CHF 4-hour chart
- USD/CHF is trading below its main SMAs suggesting a bearish bias in the medium-term.
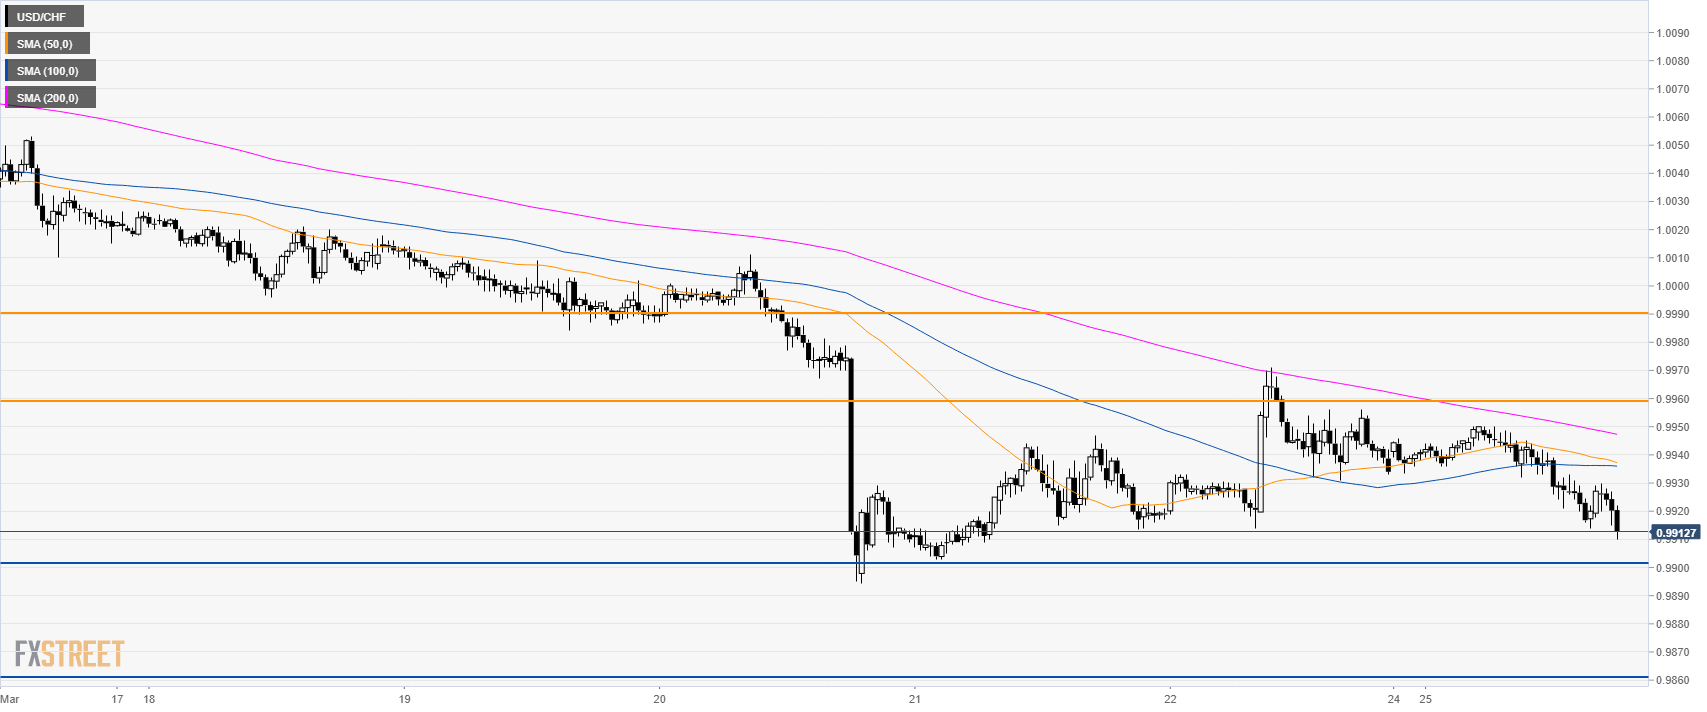
USD/CHF 30-minute chart
- USD/CHF is trading below its 200 SMA suggesting a bearish momentum in the short-term.
- A break below 0.9900 support can bring the market to 0.9960 support.
- To the upside, resistances are at 0.9960, 0.9990 and 1.0020 level.
Additional key levels
