- USD/CHF fails to extend uptick beyond 200-bar SMA, 50% Fibonacci retracement.
- The symmetrical triangle continues to favor sideways momentum.
While failure to break 200-bar SMA and 50% Fibonacci retracement speaks loudly of the USD/CHF pair’s weakness, a month-old symmetrical triangle could restrict pair’s near-term moves. The quote takes the rounds to 0.9910 by the press time of the pre-European session on Thursday.
Given the quote’s latest slip beneath key technical levels, prices are likely to revisit the support line of the five-week-old symmetrical triangle formation, at 0.9870, a break of which will open the doors for the pair additional weakness towards October month low near 0.9835 and the September bottom close to 0.9800.
On the contrary, 200-bar Simple Moving Average (SMA) around 0.9920 and 50% Fibonacci retracement level of October month declines, at 0.9935, could keep buyers await.
In a case of pair’s rise past-0.9935, 61.8% Fibonacci retracement and the triangle’s resistance can question bulls around 0.9955 and 0.9975 respectively. Though, a sustained run-up past-0.975 enables the optimists to take aim at 1.0000 and 1.0030.
USD/CHF 4-hour chart
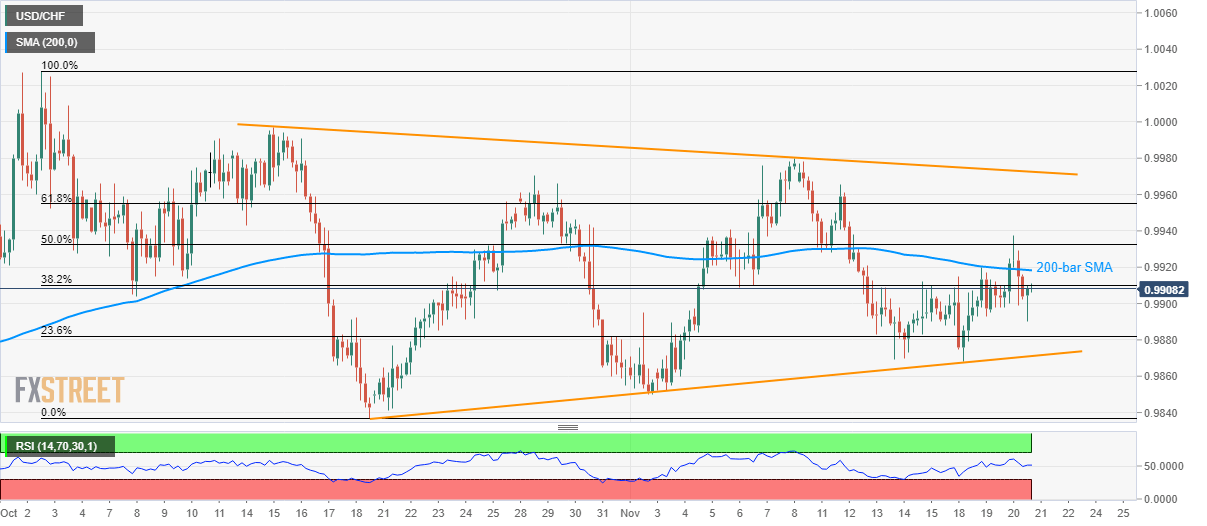
Trend: Sideways
