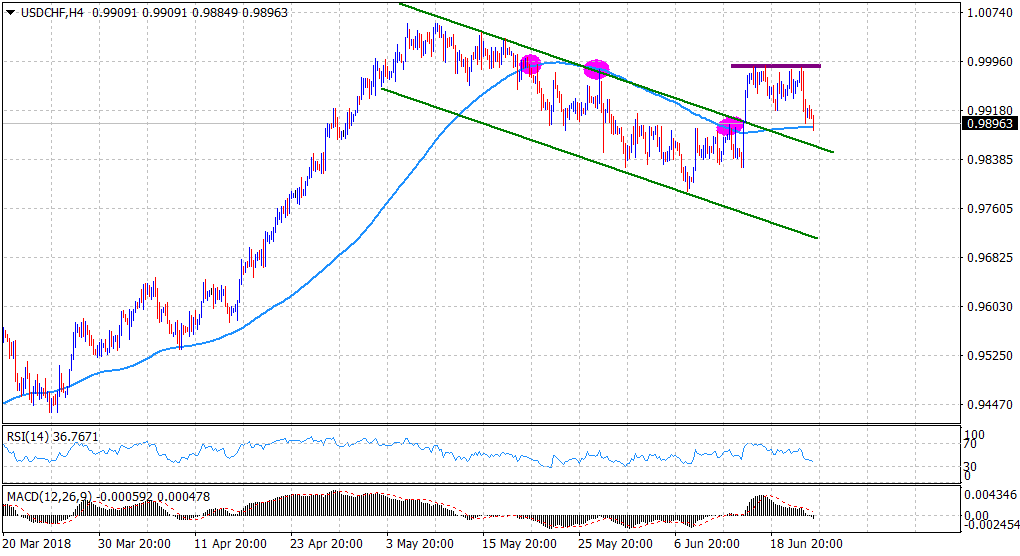
“¢ The pair struggled to build on last week’s move beyond a bullish flag and now seems to have formed a double top pattern on the 4-hourly chart.
“¢ A follow-through weakness below a previous strong hurdle now turned support, marked by 200-period SMA on the said chart would add credence to the bearish formation.
“¢ Short-term technical indicators have started drifting into negative territory and further reinforce prospects for an additional near-term downfall.
Spot Rate: 0.9896
Daily High: 0.9925
Trend: Turning bearish
Resistance
R1: 0.9925 (current day swing high)
R2: 0.9971 (R1 daily pivot-point)
R3: 1.0000 (psychological round figure mark)
Support
S1: 0.9890 (50-day SMA)
S2: 0.9865 (horizontal level)
S3: 0.9826 (last Thursday’s swing low)
