- USD/CHF declines for the fifth consecutive week.
- Sustained trading below 200-week SMA, 50% Fibonacci retracement indicates further downside.
- October-November tops act as the strong upside limit.
USD/CHF stretches its four-week-old south-run while flashing 0.9678 ahead of the European session on Tuesday.
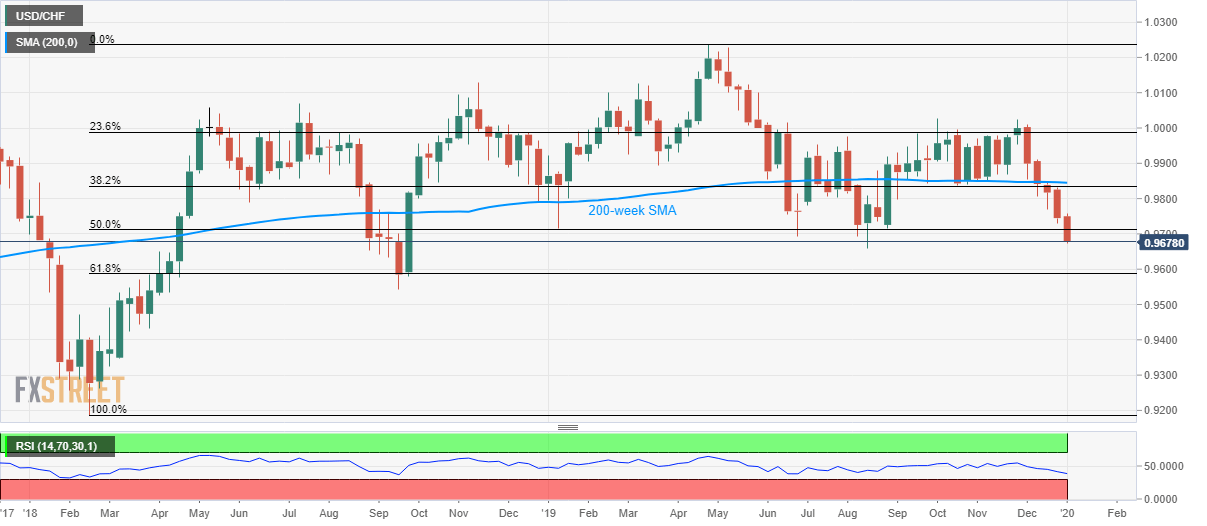
The pair stays below 50% Fibonacci retracement of the pair’s upswing from February 2016 to April 2018 tops, which in turn signal further weakness towards 61.8% Fibonacci retracement level of 0.9588. However, August month low near 0.9660 can act as an intermediate halt during the declines.
Meanwhile, pair’s pullback beyond 50% Fibonacci retracement level of 0.9715 needs to justify its strength by clearing a confluence of 200-week SMA and 38.2% Fibonacci retracement, around 0.9835/45.
In doing so, buyers can target highs marked in October and November months surrounding 1.0025/30 and March month top near 1.0125.
USD/CHF weekly chart
Trend: Bearish
