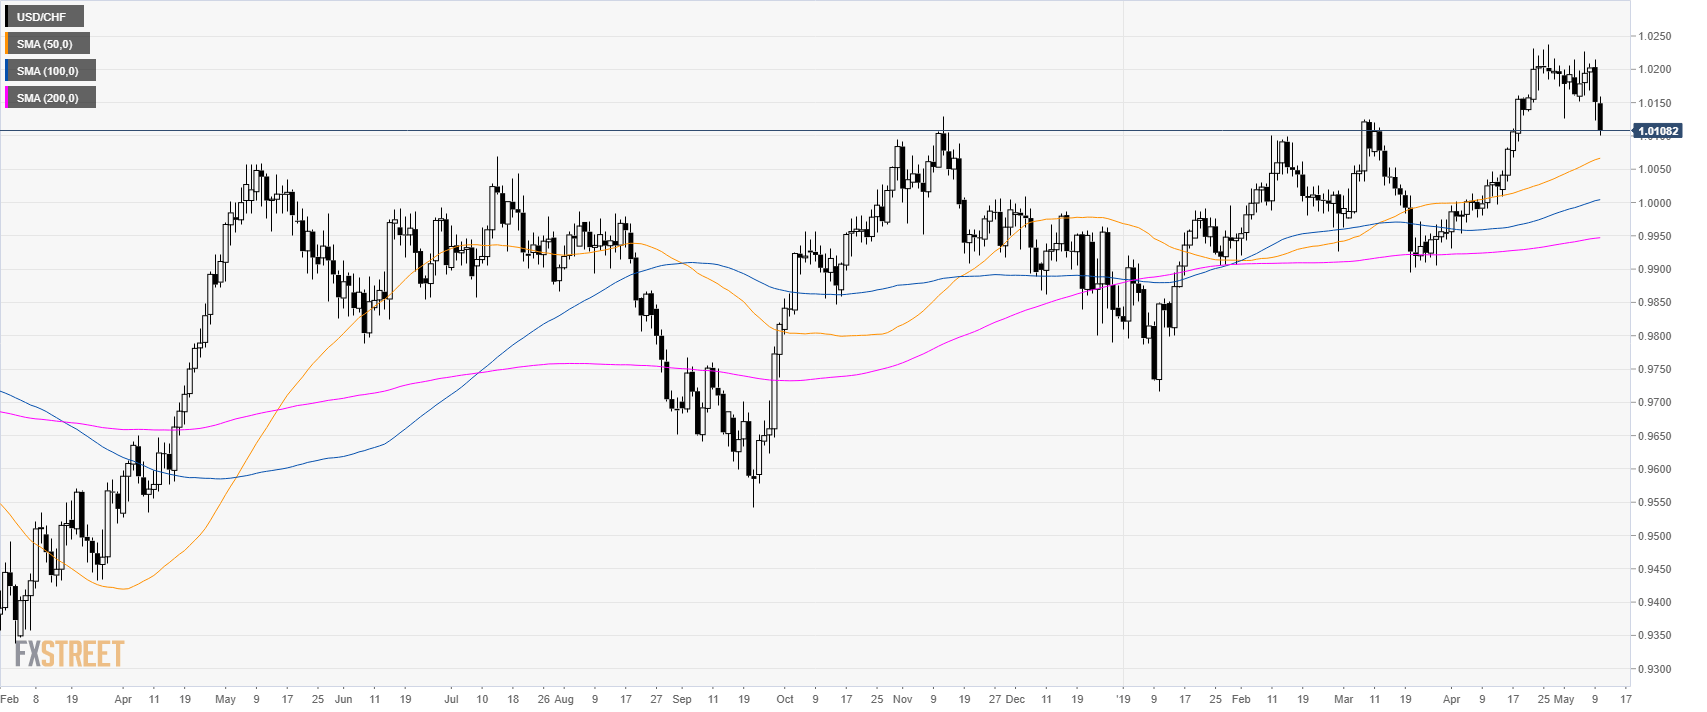
USD/CHF daily chart
USD/CHF bears are driving the market to its lowest point in the last 15 sessions.
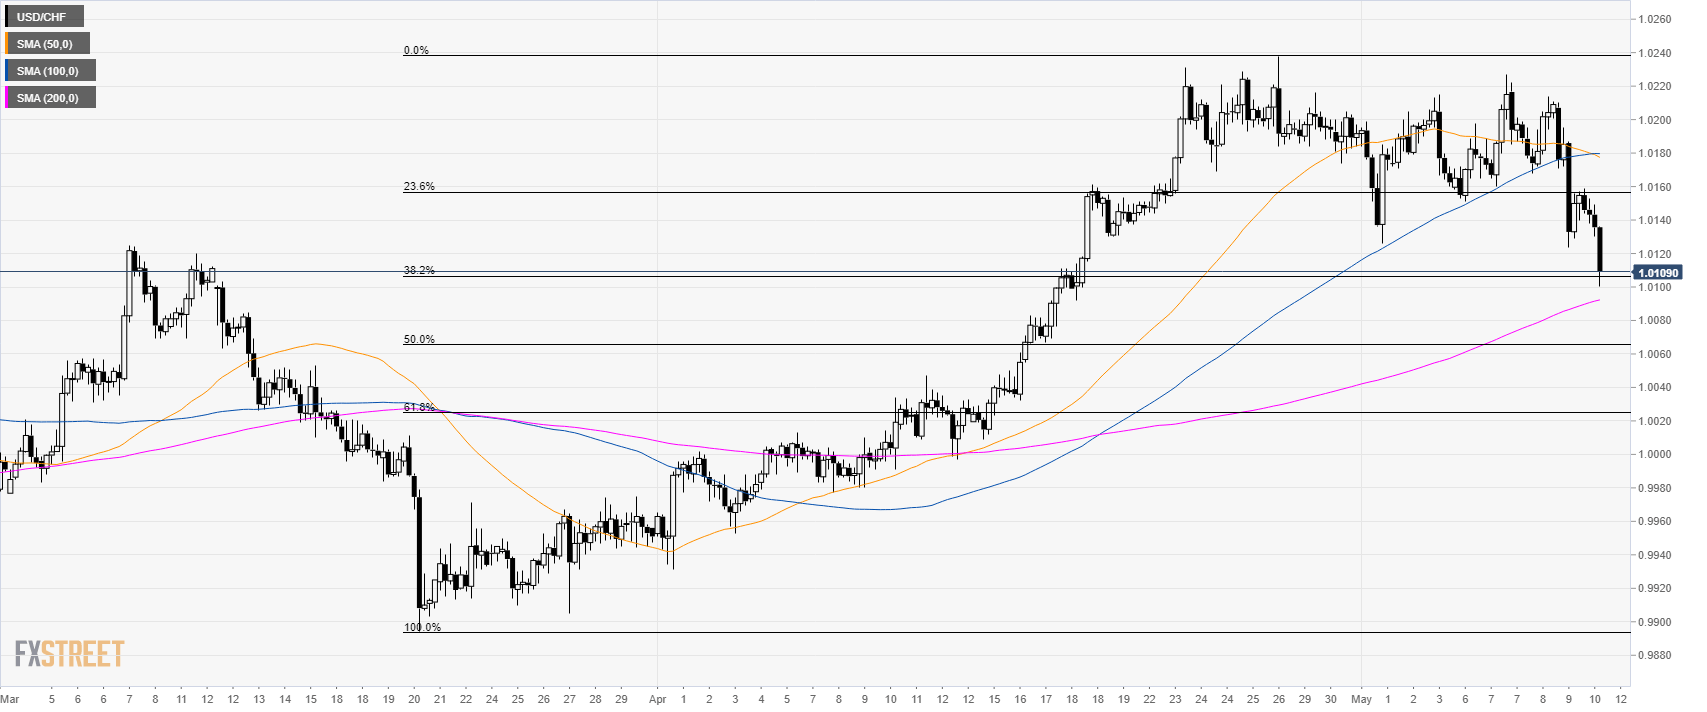
USD/CHF 4-hour chart
USD/CHF is trading below the 50 and 100 SMAs suggesting a correction down in the medium term.
USD/CHF is testing the 38.2 Fibonacci retracement from March low-April high.
There is scope for further weakness to 1.0060 the 50% Fib retracement.
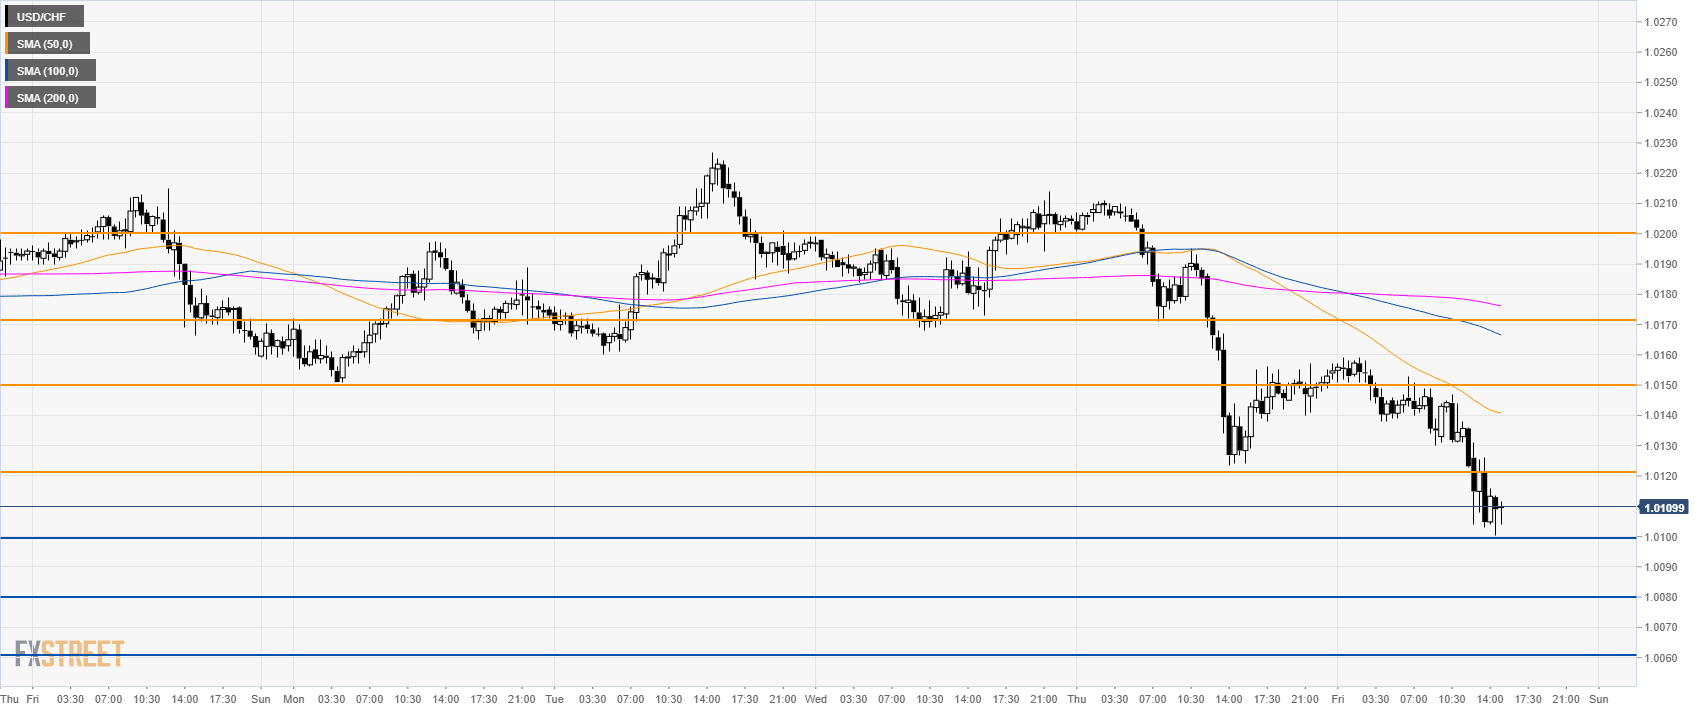
USD/CHF 30-minute chart
Sellers have been relentless on Friday as the market is trying to break below 1.0100 level. A breach below it, would open the gates to 1.0080 and 1.0060 level.
Immediate resistance is seen at 1.0120 and 1.0150 level.
Additional key levels
