“¢ The pair, this week, repeatedly failed to make it through a short-term descending trend-line resistance, extending from 14-month tops set on July 12.
“¢ Today’s rejection from 100-hour SMA, leading to a subsequent fall below 200-hour and 50-day SMA, prompted some aggressive long-unwinding/fresh selling pressure.
“¢ The ongoing downfall confirms a near-term bearish breakdown, albeit oversold technical indicators on the 1-hourly chart could be the only factor helping limit deeper losses.
USD/CHF 1-hourly chart
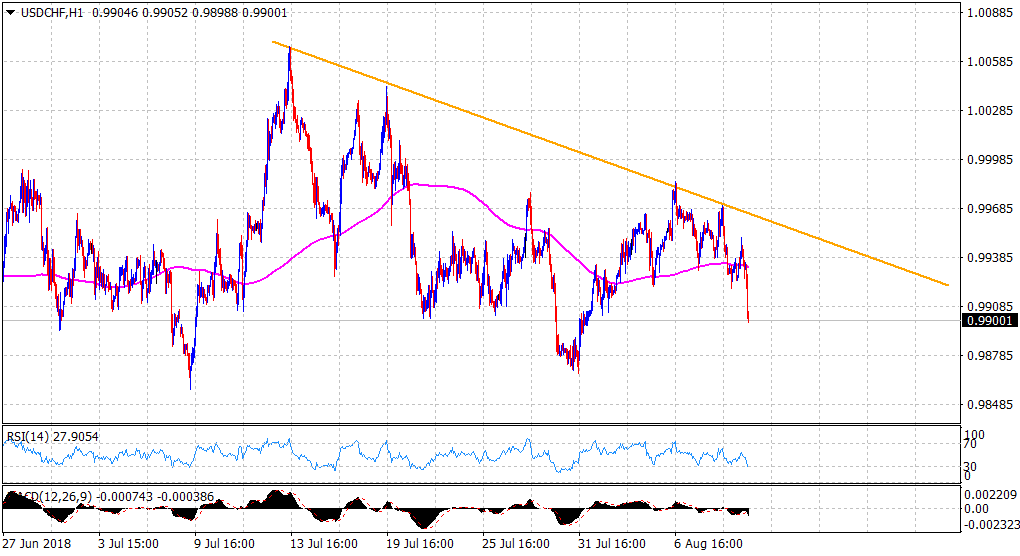
Spot Rate: 0.9900
Daily High: 0.9951
Trend: Bearish
Resistance
R1: 0.9925 (50-day SMA)
R2: 0.9951 (current day swing high)
R3: 0.9985 (weekly tops set on Monday)
Support
S1: 0.9871 (S3 daily pivot-point)
S2: 0.9852 (100-day SMA)
S3: 0.9800 (round figure mark)
