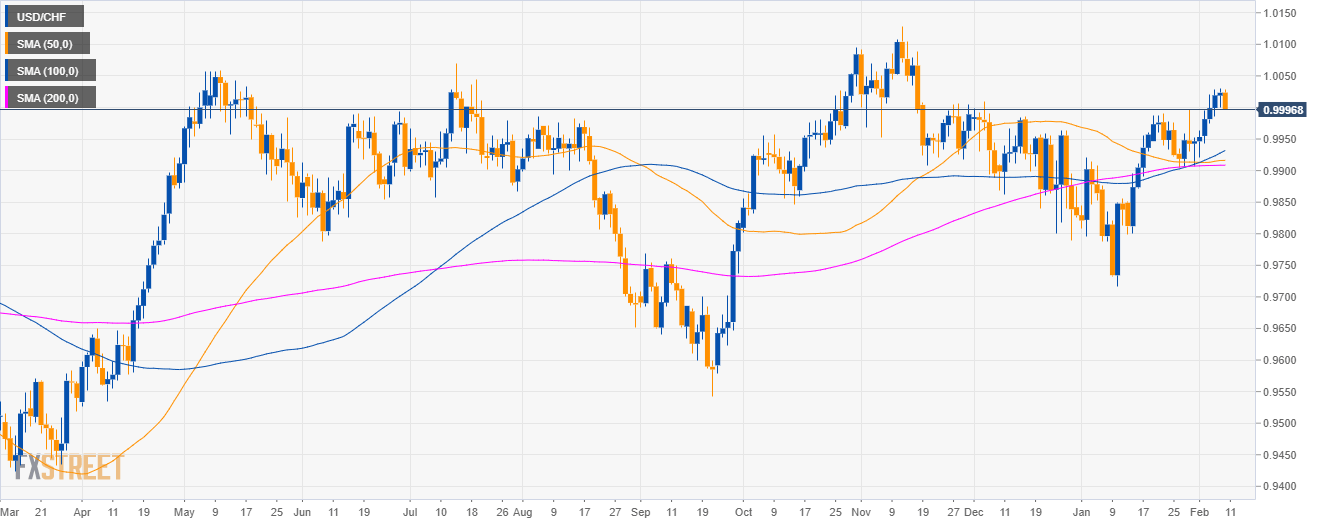
USD/CHF daily chart
- USD/CHF is trading in a sideways trend above the 50, 100 and 200-day simple moving averages (SMAs).
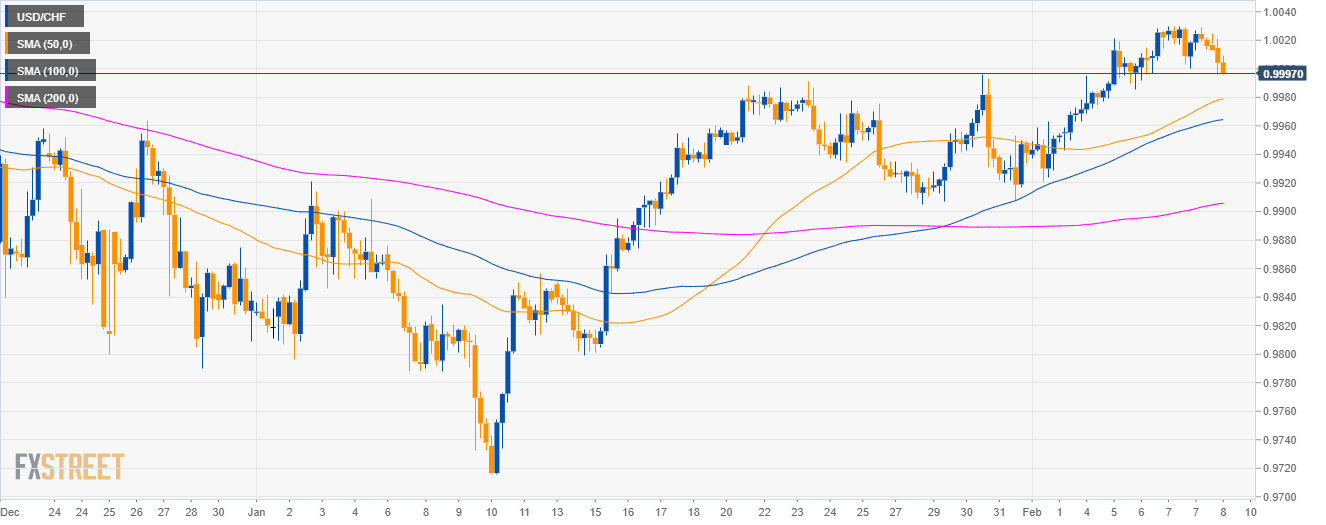
USD/CHF 4-hour chart
- USD/CHF is trading above its main SMAs suggesting bullish momentum in the near-term.
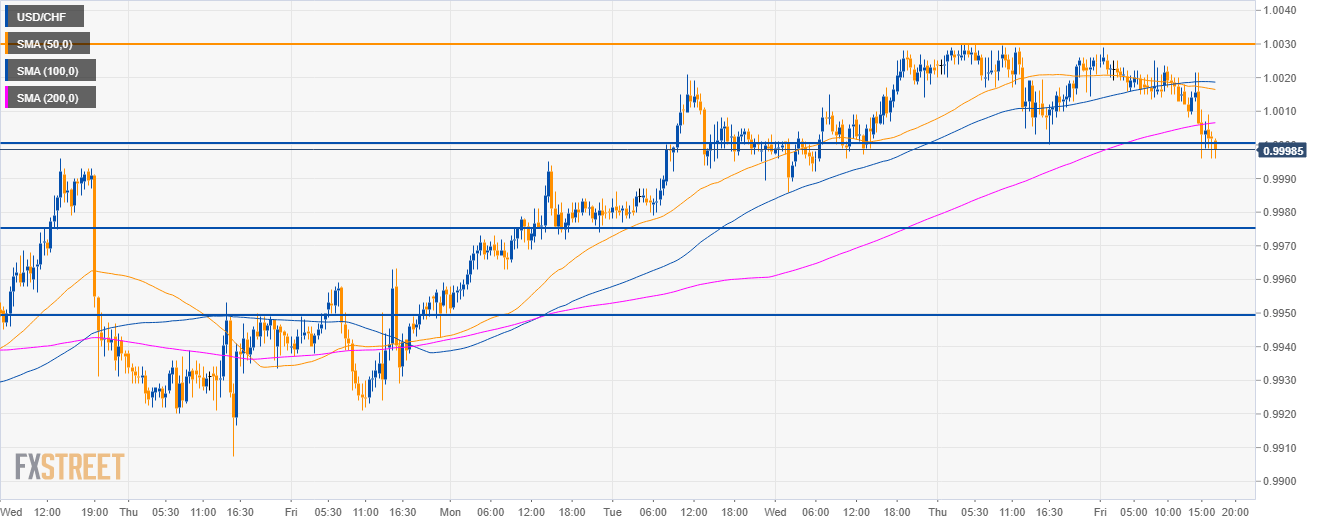
USD/CHF 30-minute chart
- USD/CHF is trading below its main SMAs suggesting bearish momentum in the short-term.
- A sustained breakdown below 1.0000 could lead to the 0.9975 and 0.9950 level to the downside.
- Resistance is seen at 1.0030 level.
Additional key levels
USD/CHF
Overview:
Today Last Price: 0.9996
Today Daily change: -27 pips
Today Daily change %: -0.27%
Today Daily Open: 1.0023
Trends:
Daily SMA20: 0.9942
Daily SMA50: 0.9916
Daily SMA100: 0.9928
Daily SMA200: 0.9908
Levels:
Previous Daily High: 1.003
Previous Daily Low: 1
Previous Weekly High: 0.9996
Previous Weekly Low: 0.9905
Previous Monthly High: 0.9996
Previous Monthly Low: 0.9716
Daily Fibonacci 38.2%: 1.0019
Daily Fibonacci 61.8%: 1.0011
Daily Pivot Point S1: 1.0005
Daily Pivot Point S2: 0.9988
Daily Pivot Point S3: 0.9975
Daily Pivot Point R1: 1.0035
Daily Pivot Point R2: 1.0048
Daily Pivot Point R3: 1.0065
