- USD/CHF remains under heavy pressure after the London close.
- The level to beat for bears is the 0.9871 level.
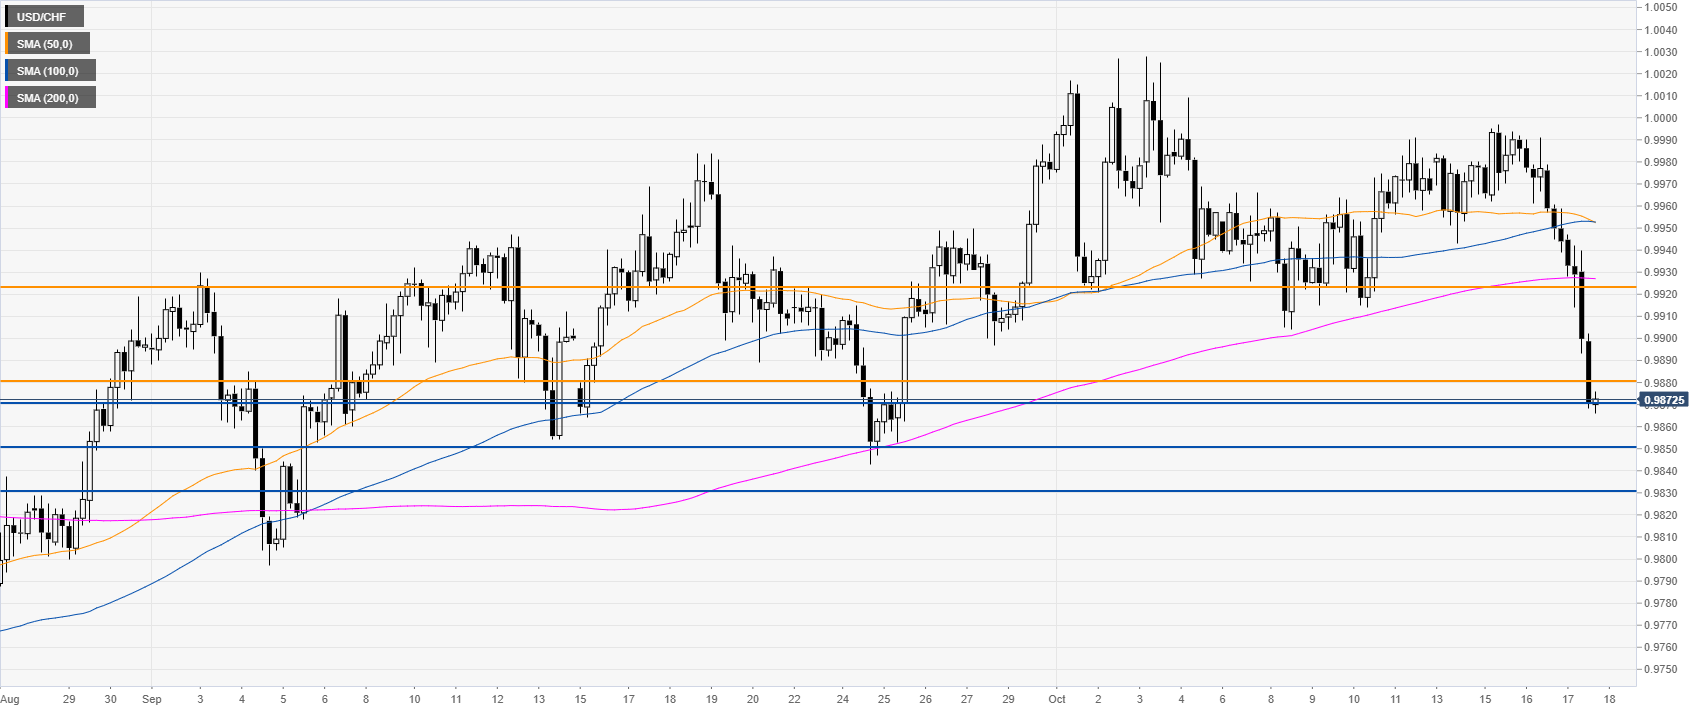
USD/CHF daily chart
On the daily chart, USD/CHF is trading in a sideways trend, now challenging the 50 and 100-day simple moving averages (DSMAs) below the 0.9900 handle.

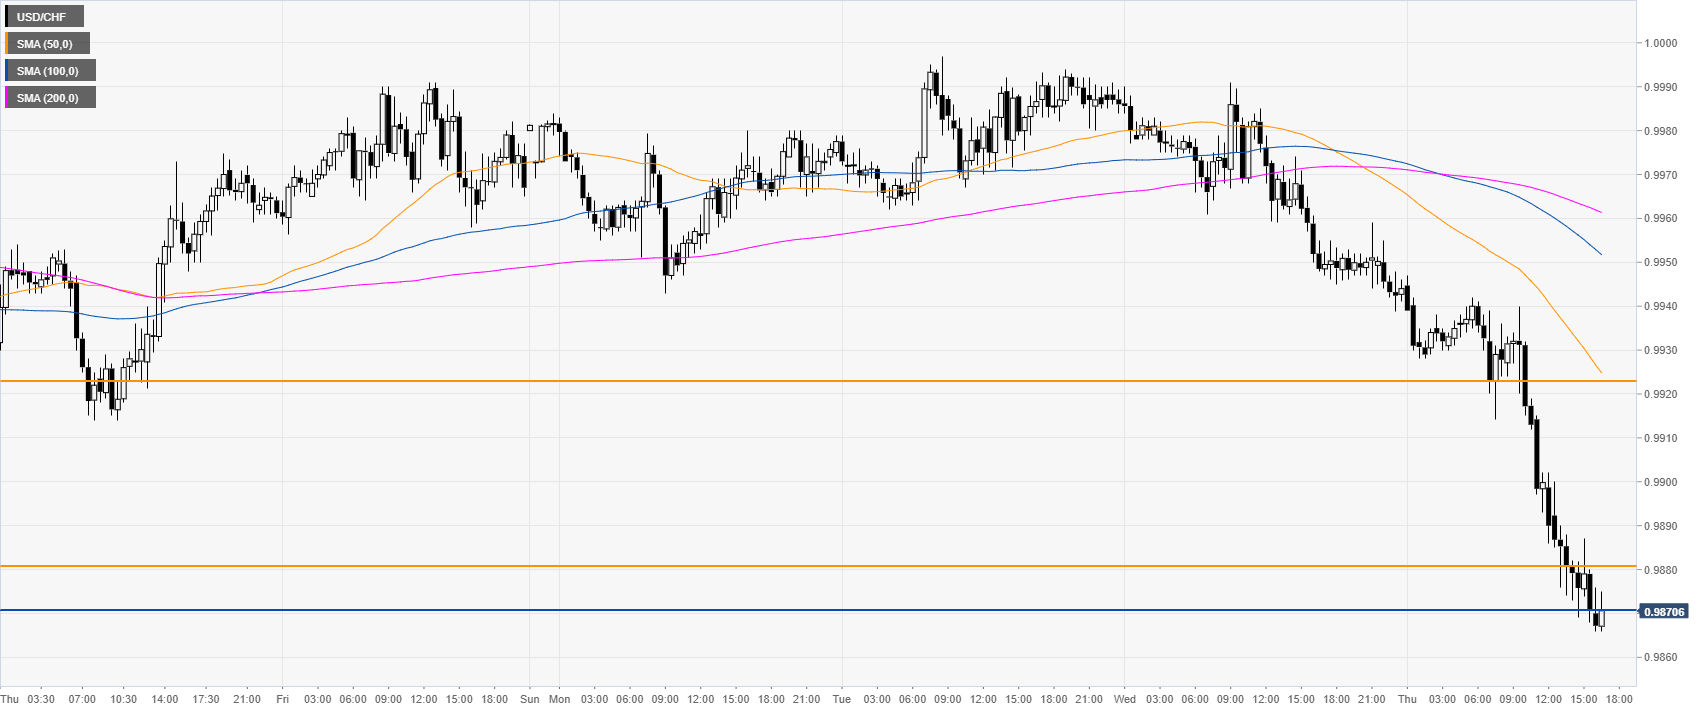
USD/CHF four-hour chart
USD/CHF is under bearish pressure below the main SMAs as the market is trading at its lowest point since late September. A continuation of the bear move below the 0.9871 support can lead to an acceleration towards 0.9850 and 0.9830 price levels, according to the Technical Confluences Indicator.
USD/CHF 30-minute chart
USD/CHF is trading below its main SMAs, suggesting a bearish bias in the near term. Resistances can be seen at the 0.9881 level and 0.9922, according to the Technical Confluences Indicator.
Additional key levels
