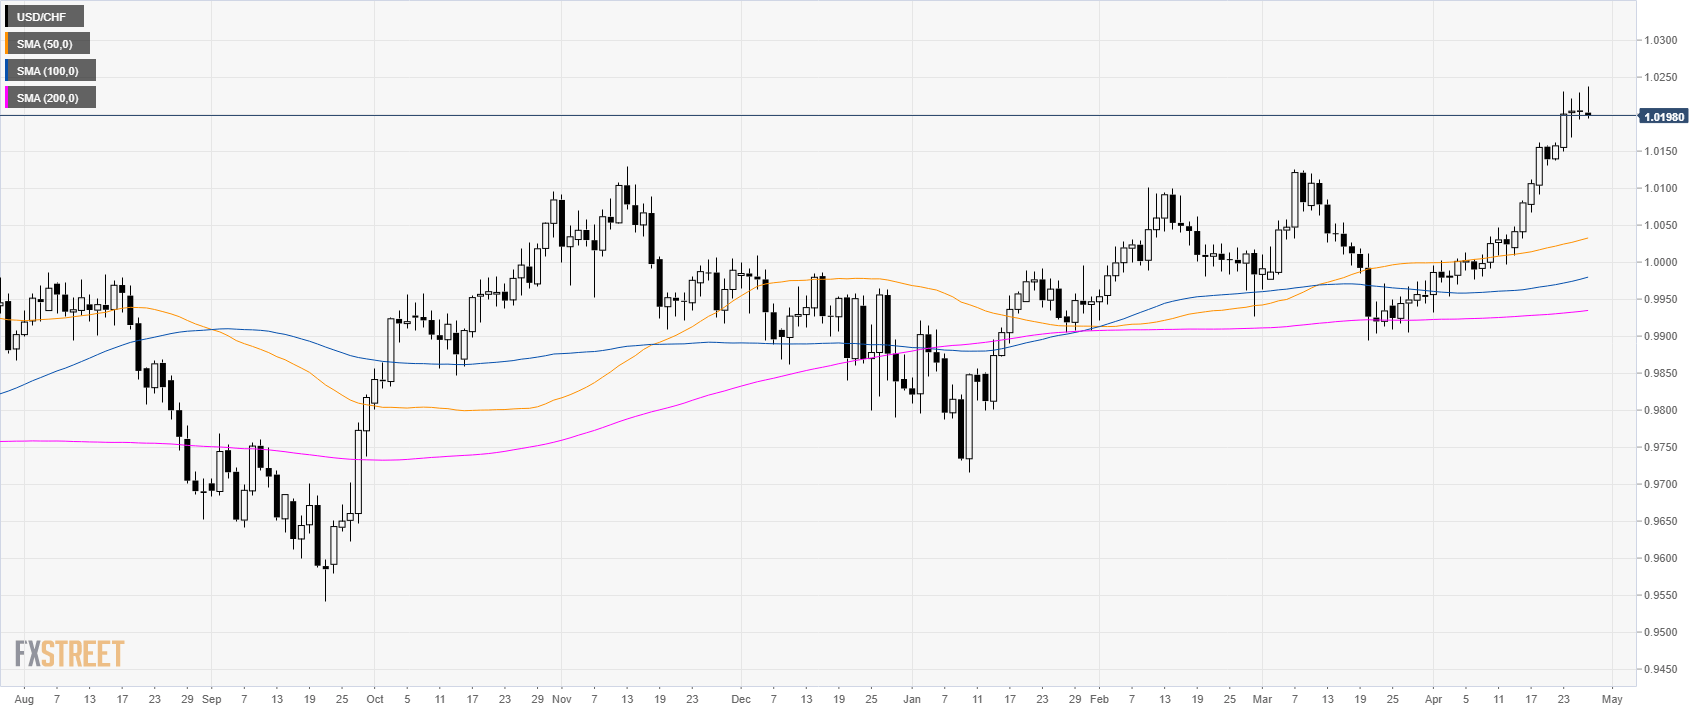
USD/CHF daily chart
- USD/CHF is trading at its highest level since January 2017.
- USD/CHF has been stuck near 1.0200 for the last 3 days.
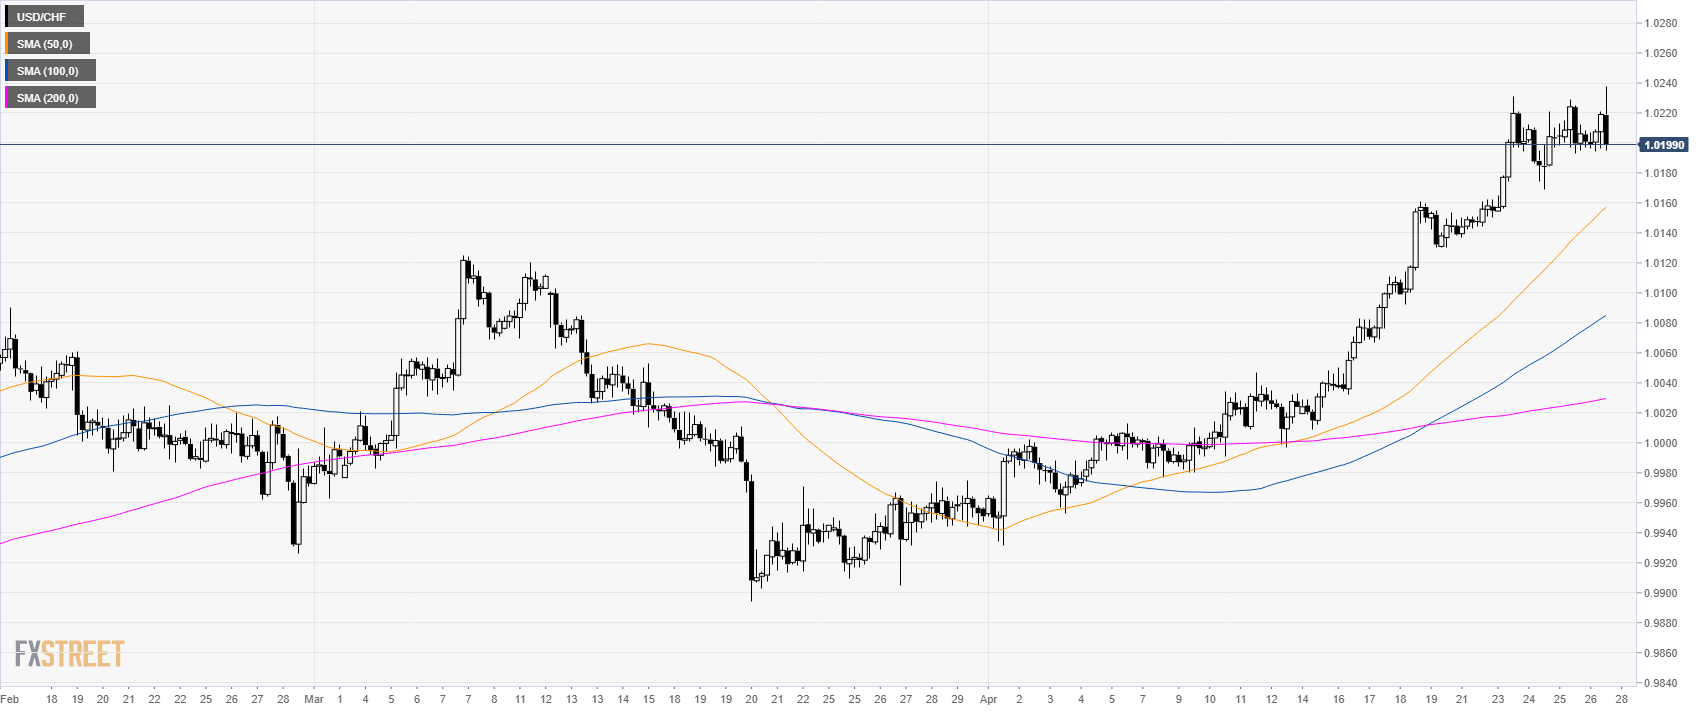
USD/CHF 4-hour chart
- USD/CHF is currently finding tough resistance near 1.0230 level.
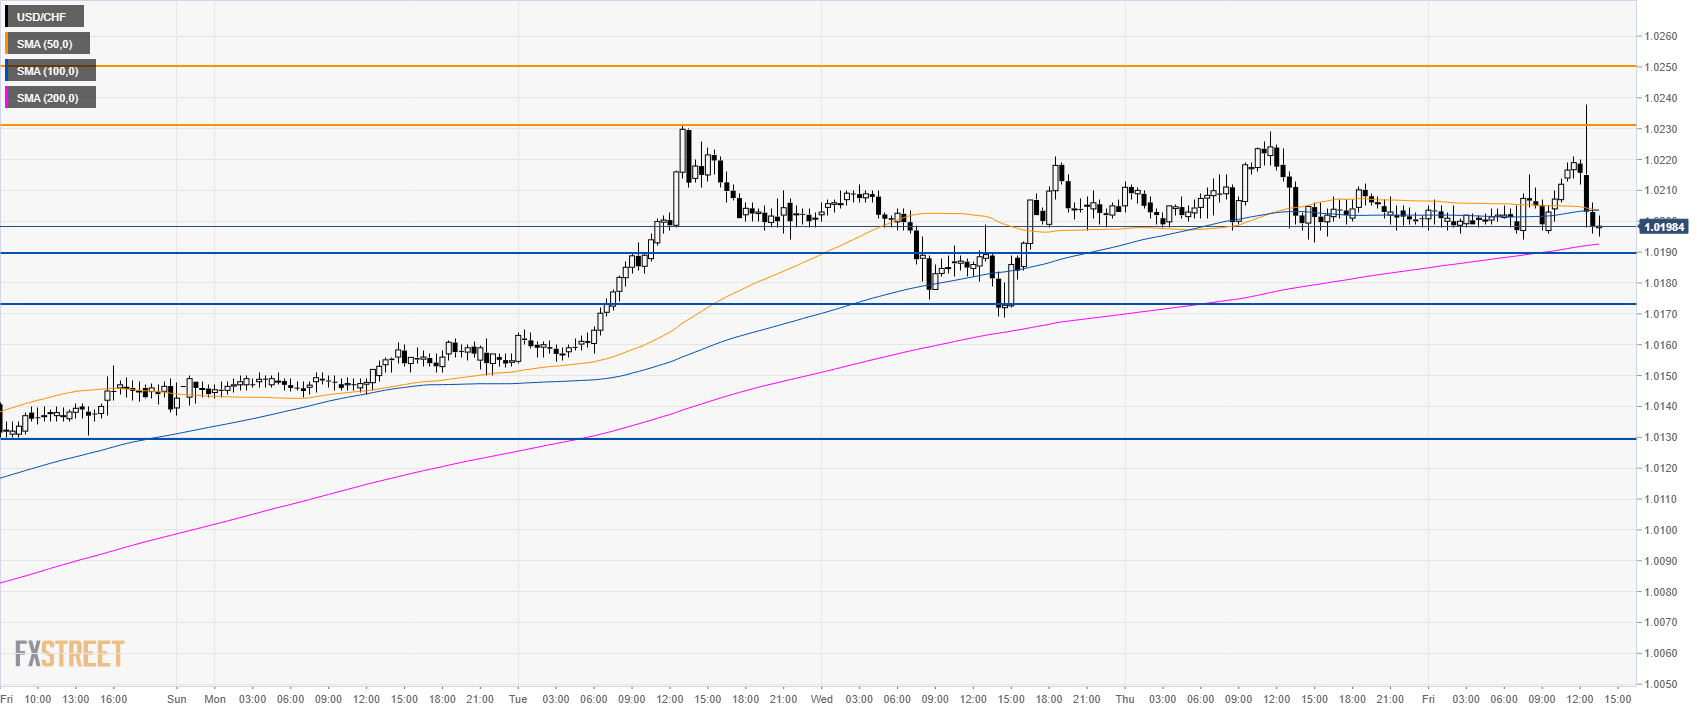
USD/CHF 30-minute chart
- The short-term momentum remains tilted to the upside as USD/CHF is trading above its 200 SMA.
- Bulls need to overcome 1.0230, 1.0250 and 1.0280 resistances.
- To the downside, support is seen at 1.0190, 1.0170 and 1.0130 levels.
Additional key levels
