- USD/CHF is erasing parts of the Fed-inspired gains.
- The correction down can extend to 0.9915, 0.9895 and 0.9860, according to the Technical Confluences Indicator.
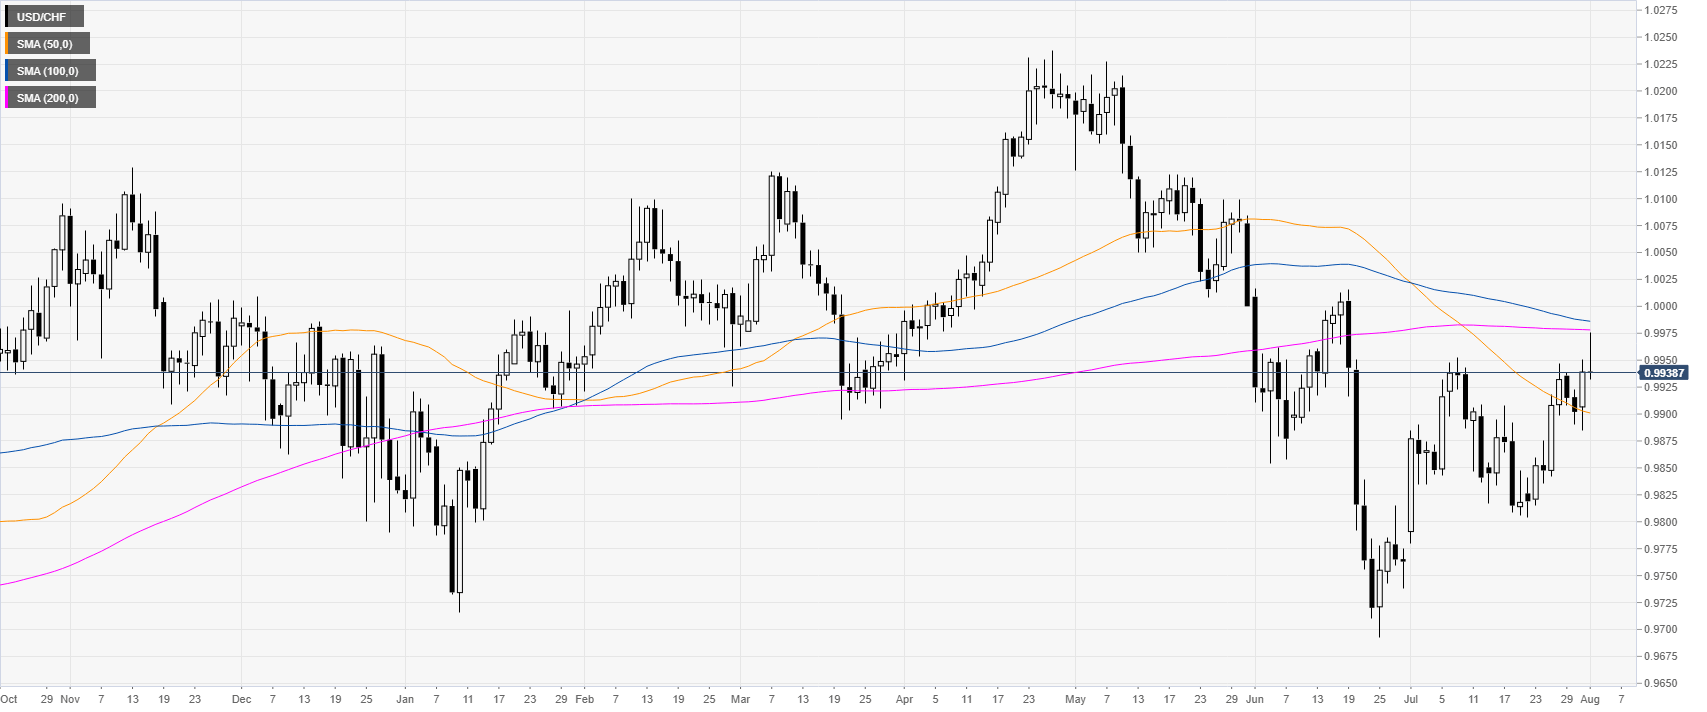
USD/CHF daily chart
USD/CHF attempted to break above July tops but is now retreating and reversing the daily gains. The market is trading below its 100/200 daily simple moving averages (DSMAs), suggesting a bearish bias.
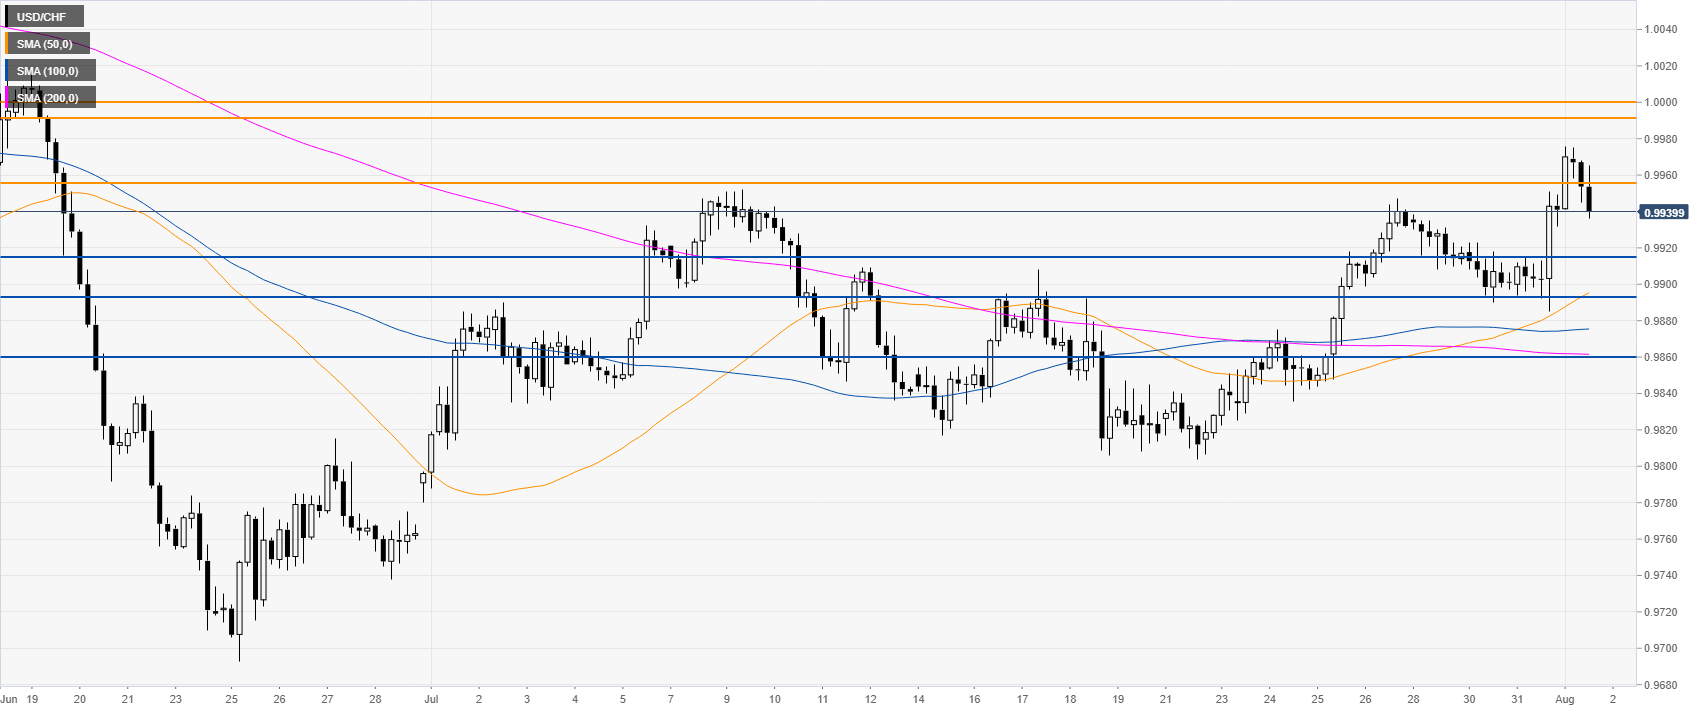
USD/CHF 4-hour chart
USD/CHF is trading above its main SMAs, suggesting bullish momentum in the medium term. However bull will need to regain the 0.9955 level if they want to continue their ascent towards 0.9990 and the parity level, according to the Technical Confluences Indicator.
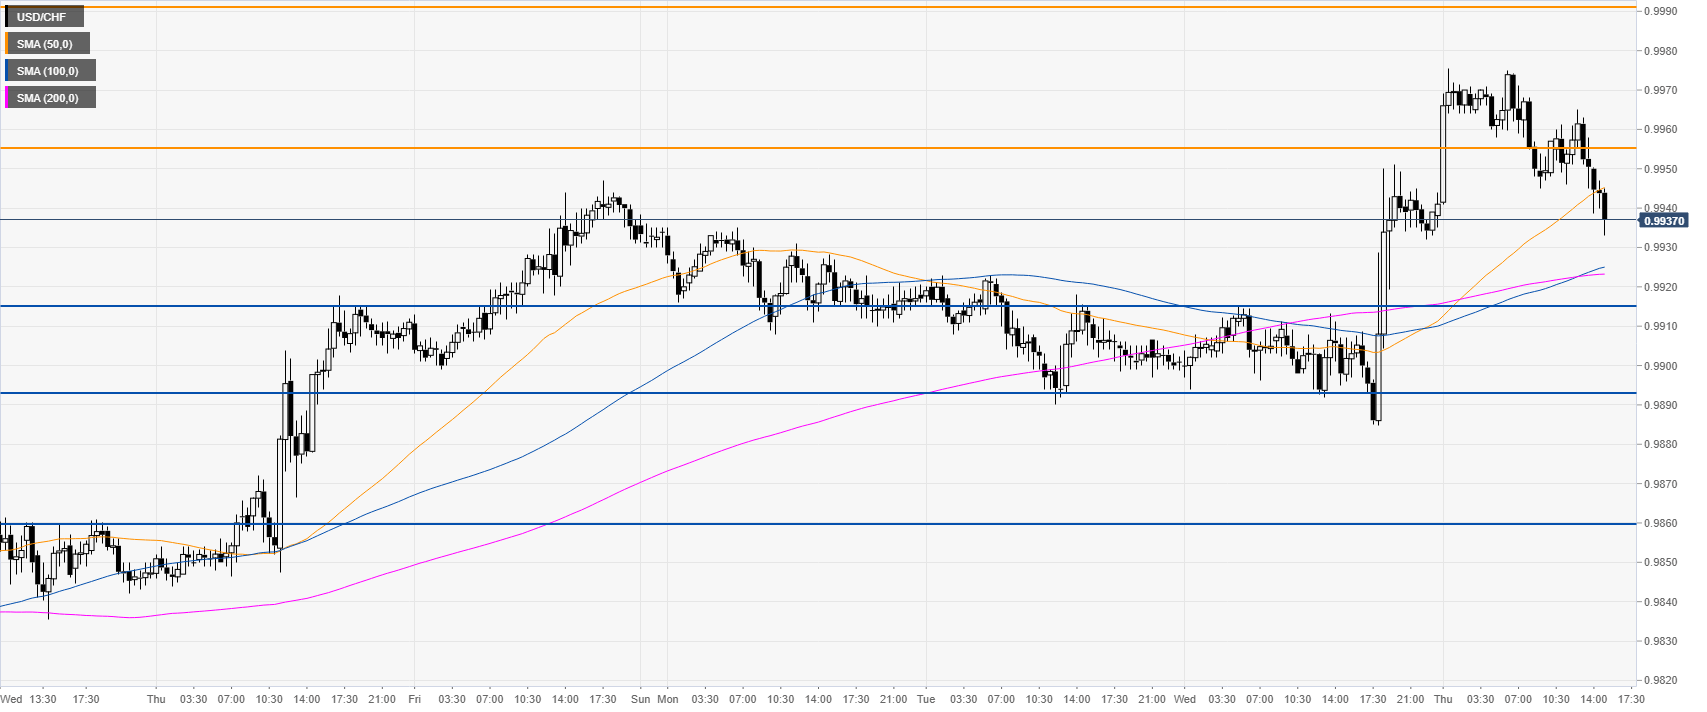
USD/CHF 30-minute chart
USD/CHF is trading below the 0.9955 resistance and the 50 SMA suggesting a correction down in the near term. The pullback down can extend towards 0.9915, 0.9895 and 0.9860, according to the Technical Confluences Indicator.
Additional key levels
