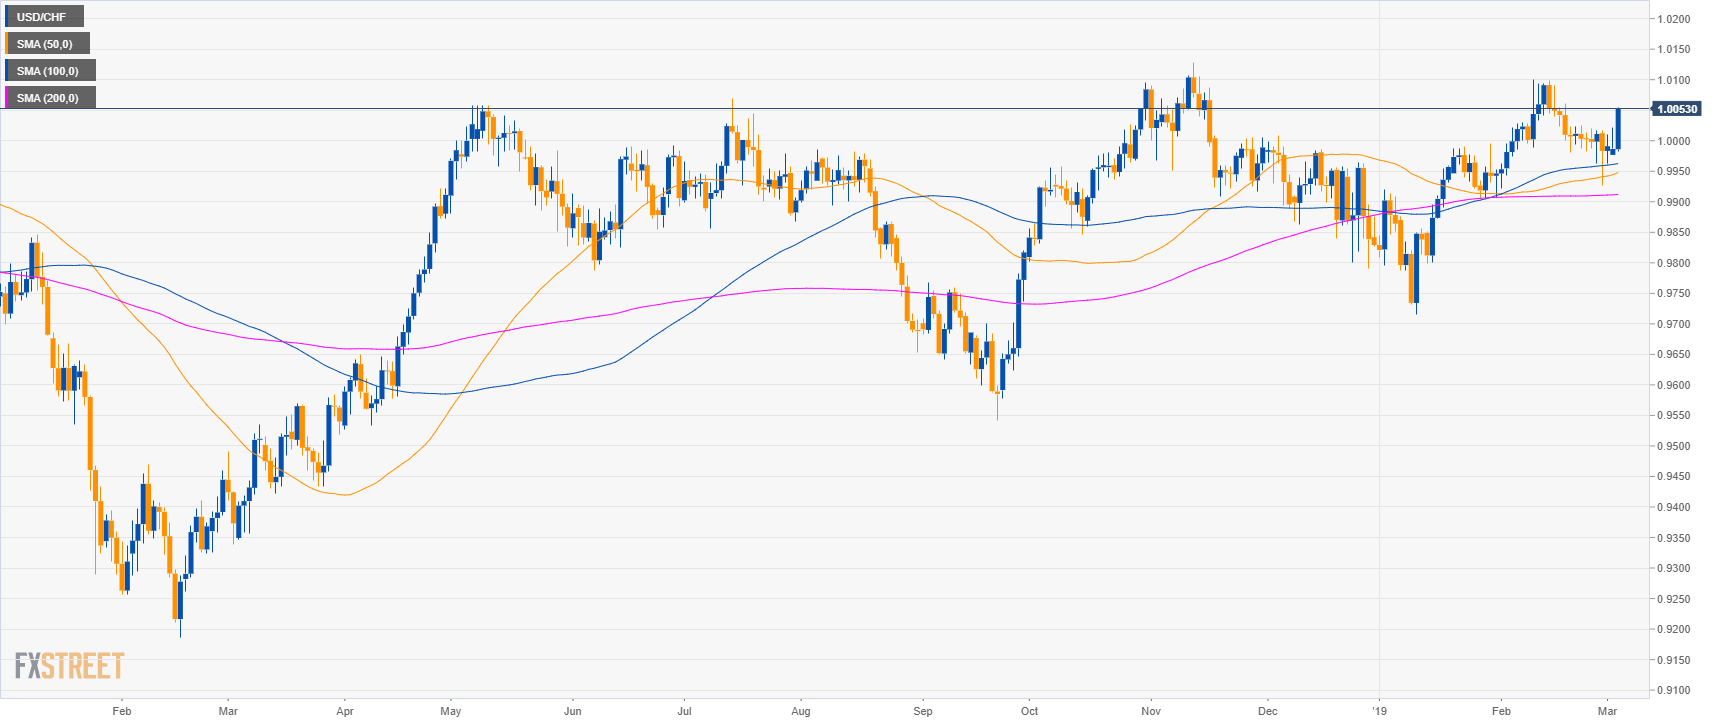
USD/CHF daily chart
- USD/CHF is trading in a sideways trend above its main simple moving averages (SMAs).
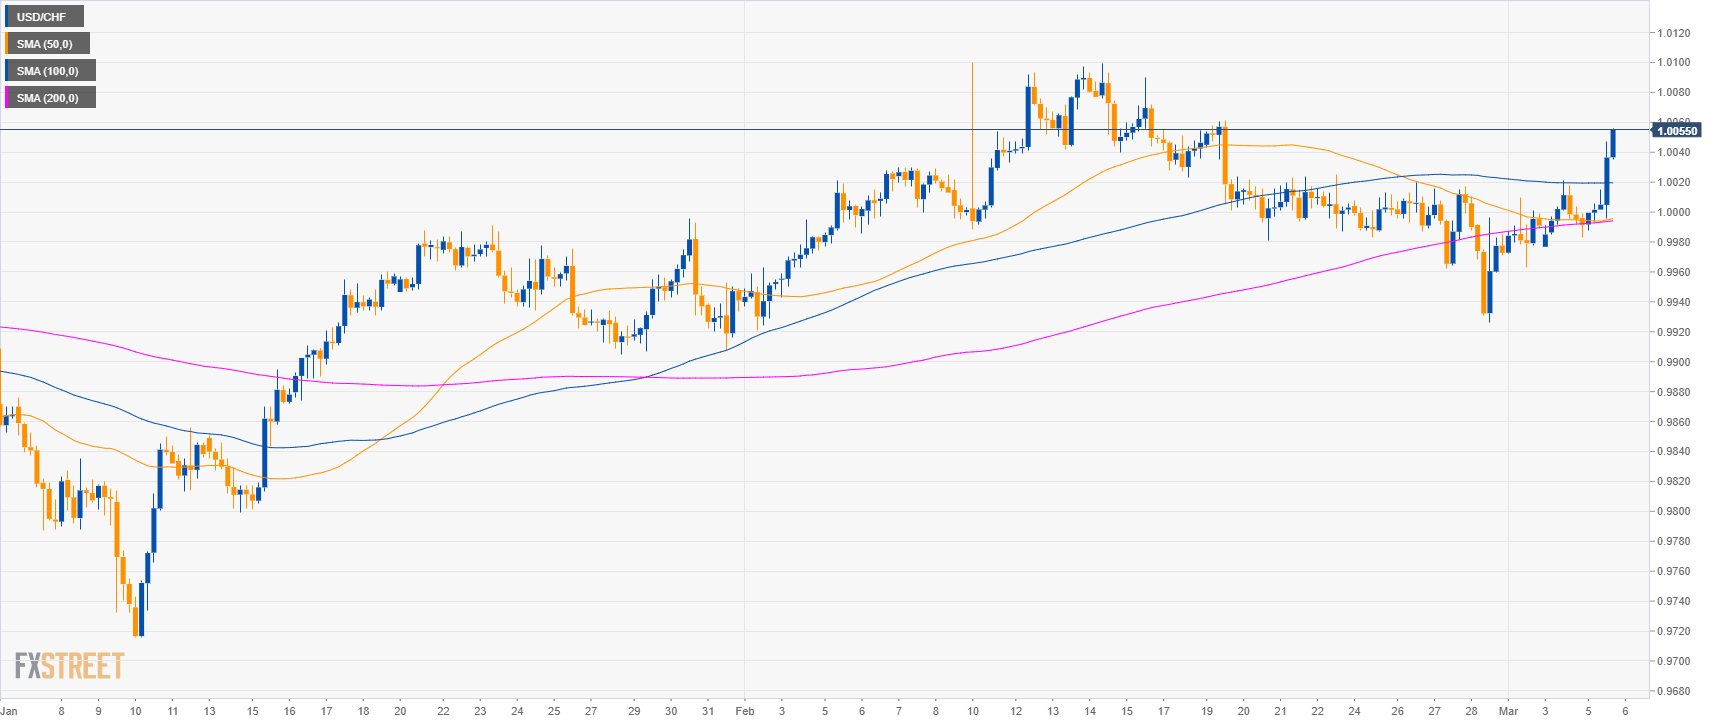
USD/CHF 4-hour chart
- USD/CHF is trading above its main SMAs suggesting a bullish bias in the medium-term.
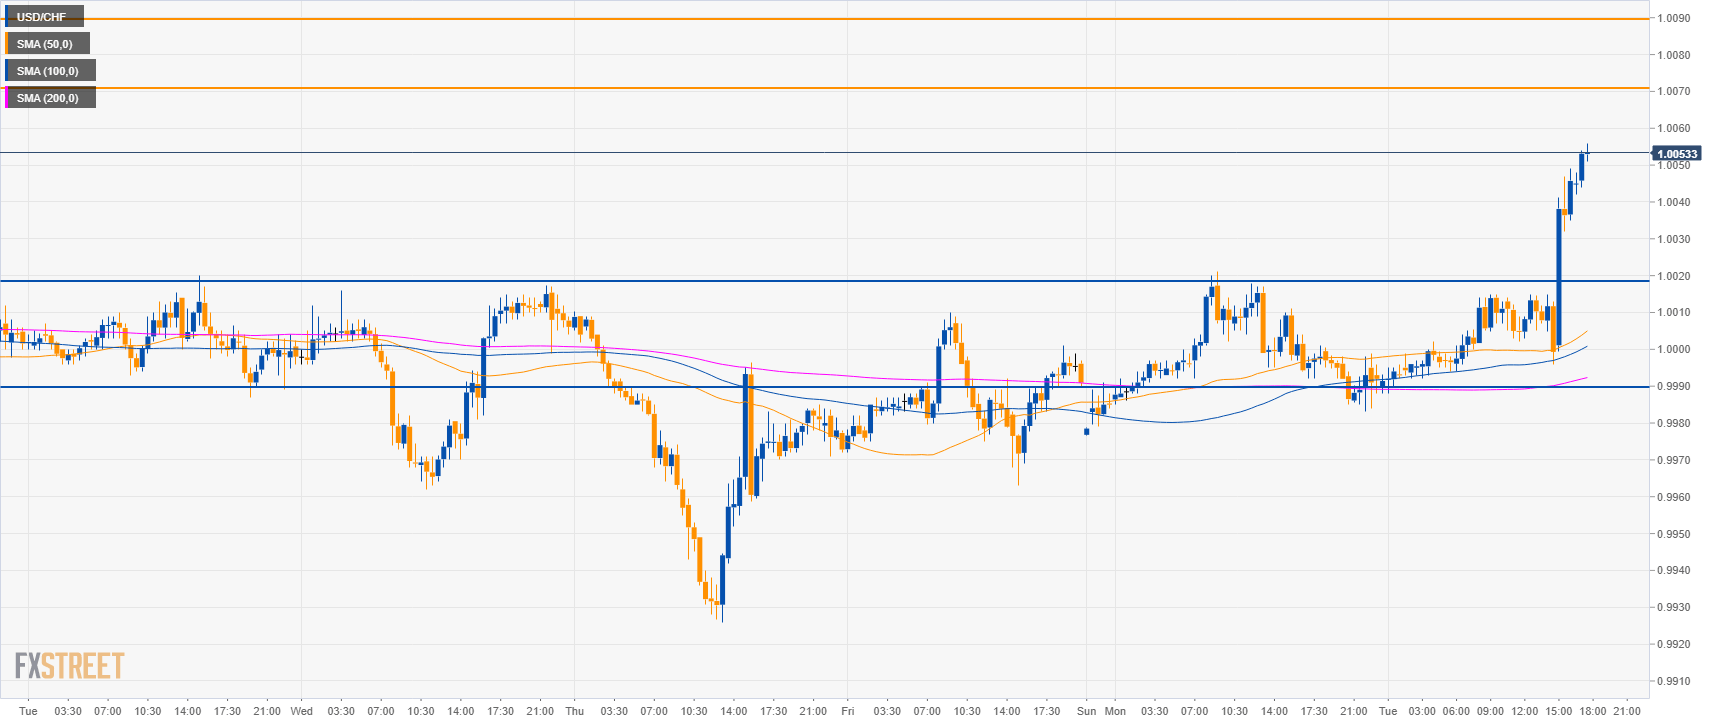
USD/CHF 30-minute chart
- USD/CHF is trading above its main SMAs suggesting bullish momentum in the short-term.
- Bulls need to break 1.0070 to reach 1.0090 to the upside.
- Support is at 1.0020 and 0.9990 level.
Additional key levels
USD/CHF
Overview:
Today Last Price: 1.0054
Today Daily change: 68 pips
Today Daily change %: 0.68%
Today Daily Open: 0.9986
Trends:
Daily SMA20: 1.0019
Daily SMA50: 0.9944
Daily SMA100: 0.9961
Daily SMA200: 0.9912
Levels:
Previous Daily High: 1.0021
Previous Daily Low: 0.9977
Previous Weekly High: 1.002
Previous Weekly Low: 0.9926
Previous Monthly High: 1.01
Previous Monthly Low: 0.9921
Daily Fibonacci 38.2%: 1.0004
Daily Fibonacci 61.8%: 0.9994
Daily Pivot Point S1: 0.9968
Daily Pivot Point S2: 0.995
Daily Pivot Point S3: 0.9924
Daily Pivot Point R1: 1.0013
Daily Pivot Point R2: 1.0039
Daily Pivot Point R3: 1.0057
