- USD/CHF pulls back from six week high.
- Falling trend line since early October, 200-day SMA keeps buyers hopeful.
- An upside beyond mid-October high could escalate pair’s run-up towards the previous month high.
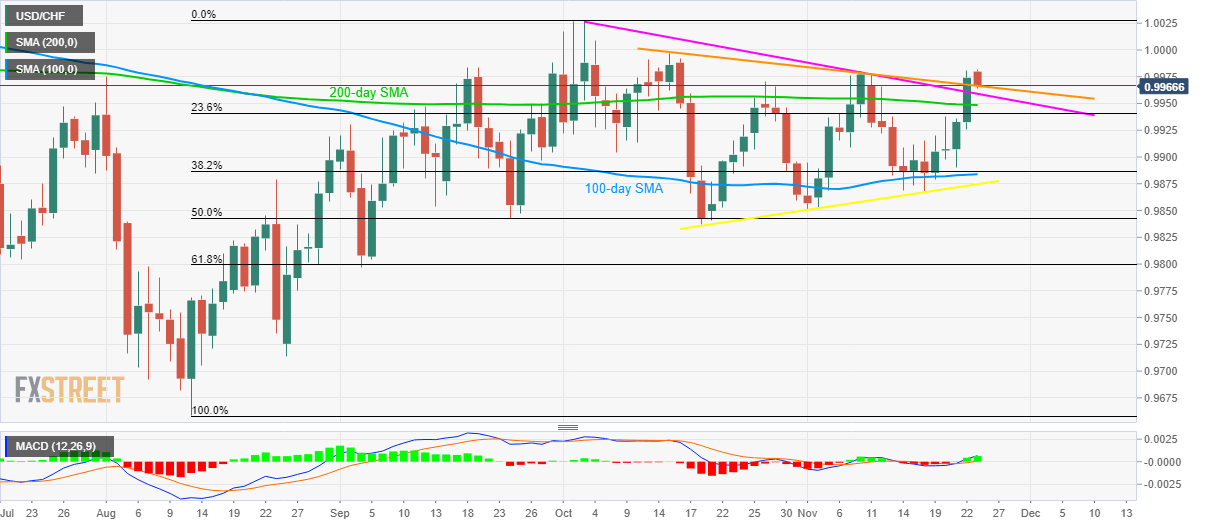
USD/CHF fails to hold the recent trend line breakout while declining to 0.9970 during early Monday.
Even so, the quote stays beyond a multi-week-old falling support-line, at 0.9960, while also trading above 200-day Simple Moving Average (SMA) level of 0.9948.
As a result, buyers can still wait for an upside break of 1.0000 mark before liquidating their longs. In that case, October month high around 1.0030 and late-May top near 1.0100 will be on their radars.
On the downside, pair’s declines below 200-day SMA level of 0.9948 will target 0.9900 round-figure whereas a confluence of 100-day SMA and 38.2% Fibonacci retracement of August-October upside, around 0.9987/83, could keep further declines limited.
If bears dominate below 0.9983, an upward sloping trend line since October 18, at 0.9875 will be the key as a break of which could recall the previous month low near 0.9835 to the charts.
USD/CHF daily chart
Trend: Pullback
