- USD/CHF clings to 23.6% Fibonacci retracement of the pair’s downpour from Christmas to December 31.
- The falling channel, 200-HMA will challenge the Bullish MACD.
- The current month top will lure the buyers during further upside.
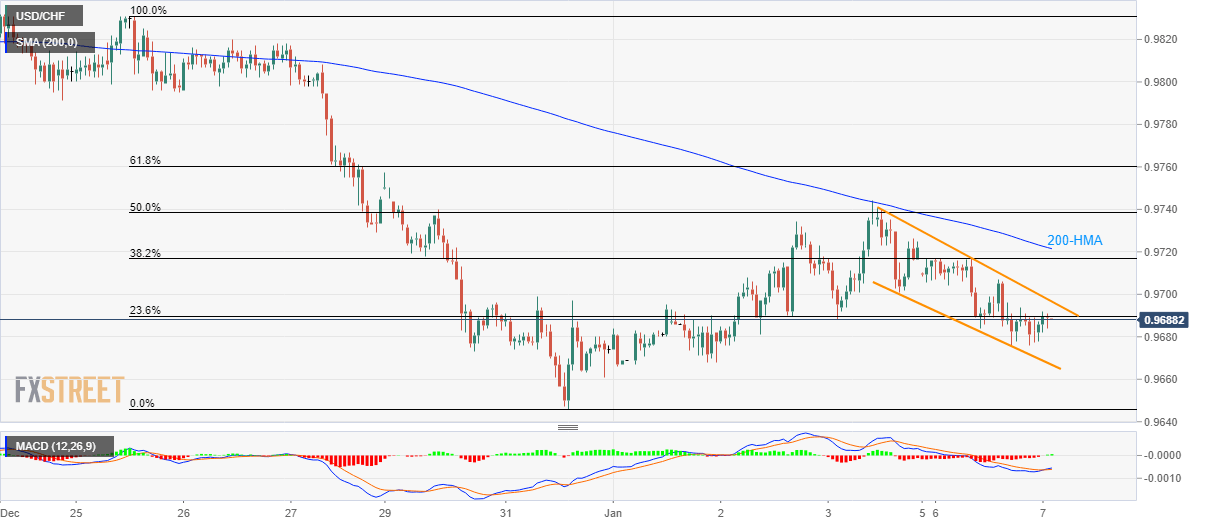
The USD/CHF pair’s latest recovery seems to struggle around 0.9690 during early Tuesday. A short-term falling trend channel and prices below 200-Hour Moving Average (HMA) seem to question the recently bullish MACD.
As a result, buyers will look for a clear break of 200-HMA level of 0.9722 ahead of targeting the month’s top near 0.9745. It’s worth mentioning that the channel’s resistance-line, at 0.9700, can become an immediate upside barrier.
If at all USD/CHF prices remain strong beyond 0.9745, 0.9770 and December 25 top near 0.9830 will be on the Bull’s radar.
Alternatively, the aforementioned channel’s support, at 0.9668 now, can restrict the pair’s immediate declines ahead of highlighting December month low near 0.9645.
Given the Bear’s dominance below 0.9645, September 2018 bottom surrounding 0.9540 could grab the spotlight.
USD/CHF hourly chart
Trend: Bearish
