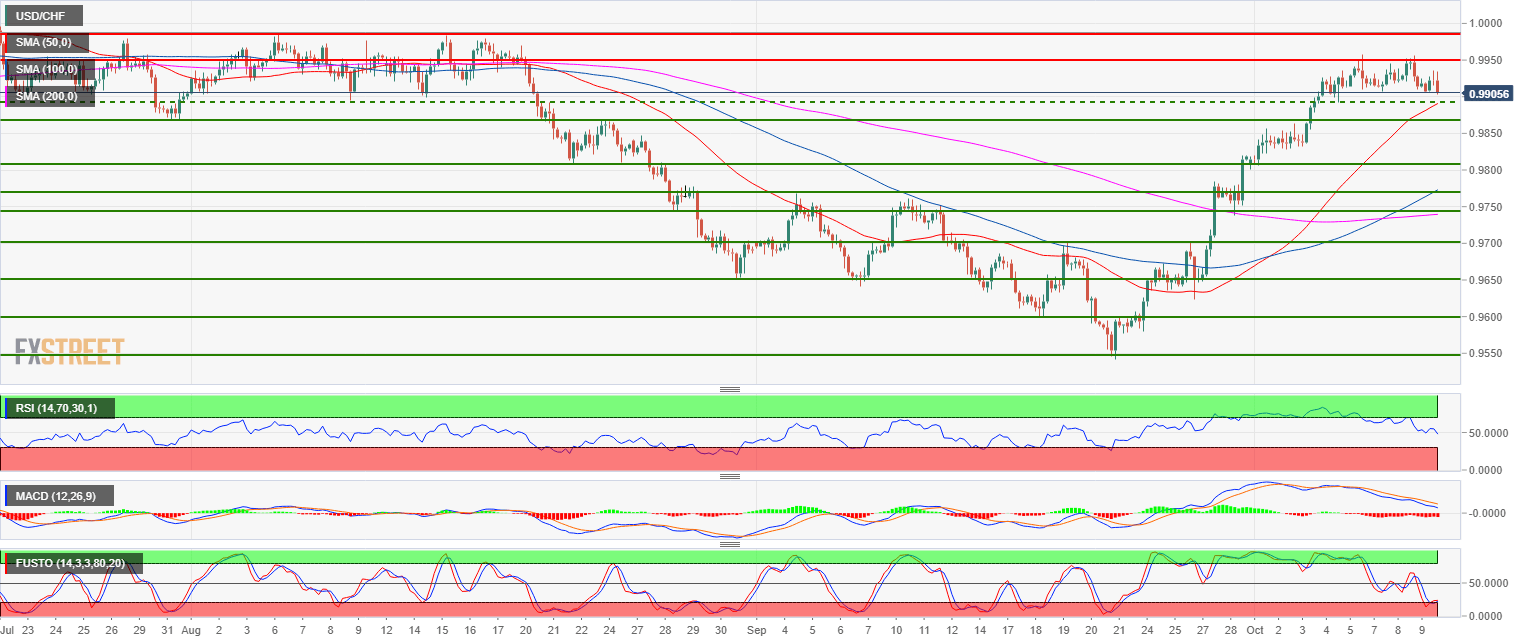
- USD/CHF is evolving in a bull trend as the 50 and 100-period simple moving averages (SMA) are moving upward. The 100 SMA crossed above the 200 SMA which is considered a bullish clue known as a golden cross.
- However, USD/CHF found resistance below the 0.9950 level as the MACD is bearish.
- In the absence of a significant breakout above 0.9950, USD/CHF is set to trade sideways to down towards 0.9891 (October 4 low), 0.9868 (July 31 low) and 0.9807 (August 22 low )
Spot rate: 0.9903
Relative change: -0.13%
High: 0.9934
Low: 0.9902
Main trend: Bullish
Short-term trend: Beraish below 0.9950
Resistance 1: 0.9950 figure
Resistance 2: 1.0000 parity level
Resistance 3: 1.0068 July 13 high
Support 1: 0.9891 October 4 low
Support 2: 0.9868 July 31 low
Support 3: 0.9820 August 25 low
Support 4: 0.9807 August 22 low
Support 5: 0.9788 June 7 swing low (key level)
Support 6: 0.9768 September 4 swing high
