- USD/CNH bounces off the lowest levels since March 17, remains in the red.
- Stocks in China extend the previous day’s gains amid hopes of further stimulus, virus vaccine.
- Oversold RSI conditions challenge the bears targeting 61.8% Fibonacci retracement.
- 200-day EMA offers an immediate upside barrier to watch during the pullback.
USD/CNH pulls back from 6.9965 to 7.0080 during the early Tuesday’s trading. Even so, the pair flashes 0.08% loss from the lowest point since mid-March flashed earlier during the Asian session. While oversold RSI conditions seem to trigger the pair’s latest retracements, a sustained trading below 200-day EMA and extension of the breakdown of an ascending trend line stretched since January 20 favor the bears.
Other than the technicals, the recent rally in Chinese stocks, up over 2.0% by the press time, also exert downside pressure on the pair. Equities from Beijing are likely cheering hopes of additional stimulus and the virus vaccine after the Global Times (GT) cited the third trial of the cure in Brazil.
Read: ASX 200 Index: Bulls in charge in broad-based rally in global stocks
As a result, the sellers are currently targeting 61.8% Fibonacci retracement of January-April upside, at 6.9788, on the extended weakness of past-7.000 round-figures. During the pair’s further south-run past-the key Fibonacci retracement, the early-February lows near 6.9570 can offer intermediate halts before highlighting the March month bottom close to 6.9050.
Meanwhile, 200-day EMA and the support-turned-resistance line, respectively around 7.0390 and 7.0510, could limit the pair’s short-term recovery moves. Additionally, a downward slopping trend line from May 27, currently around 7.0630, offers additional resistance to watch.
USD/CNH daily chart
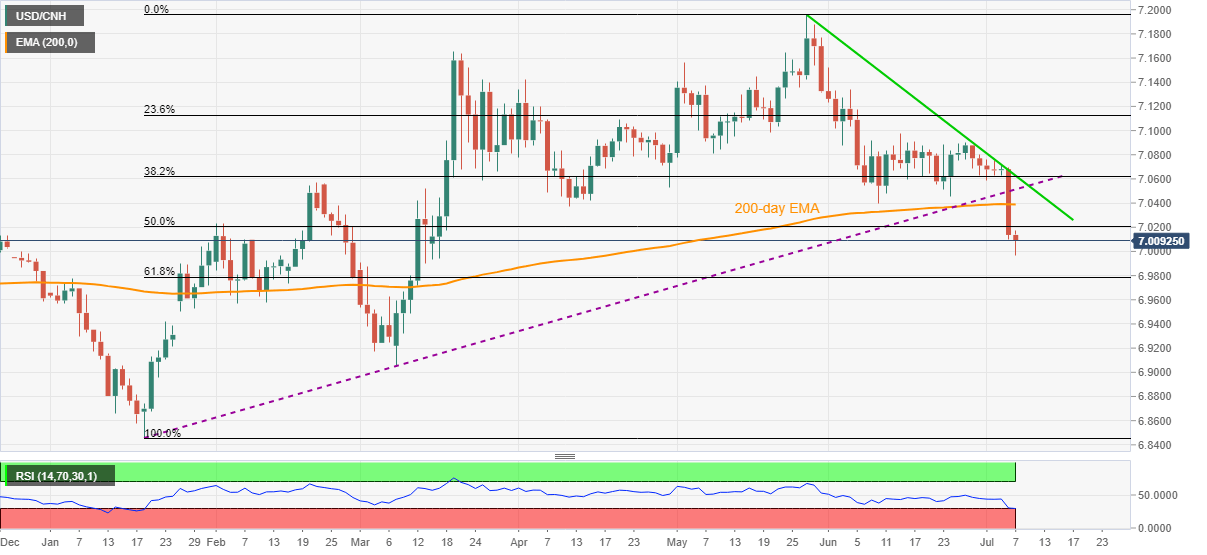
Trend: Bearish
