- The USD/CNH hourly chart shows a pennant pattern.. An upside breakout would mean continuation of the rally (or sell-off in offshore Yuan exchange rate) and would allow a break above the recent high of 6.7292.
- A technical correction would gather pace if the pennant is breached to the downside. This scenario is likely as the daily RSI is flashing overbought conditions.
Hourly chart
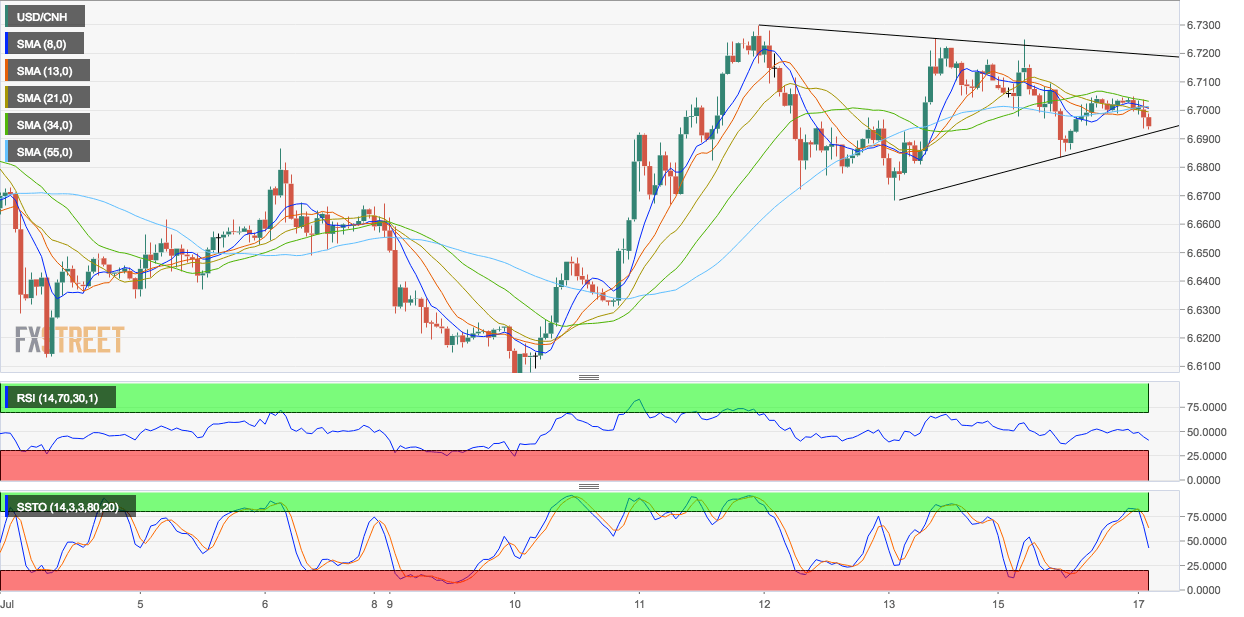
Spot Rate: 6.6982
Daily High: 6.7043
Daily Low: 6.6933
Trend: Depends on the direction of pennant breakout
R1: 6.7292 (July 12 high)
R2: 6.7329 (July 3 high)
R3: 6.78 (Dec 2016 low)
Support
S1: 6.6741 (10-day MA)
S2: 6.65 (23.6% Fib R of June 14 low-July 14 high)
S3: 6.59 (July 10 low)
