- USD/IDR bounces off one week low.
- Bearish MACD, a sustained trading below short-term key resistances keep sellers hopeful.
- Buyers will have multiple upside barriers before targeting the record top.
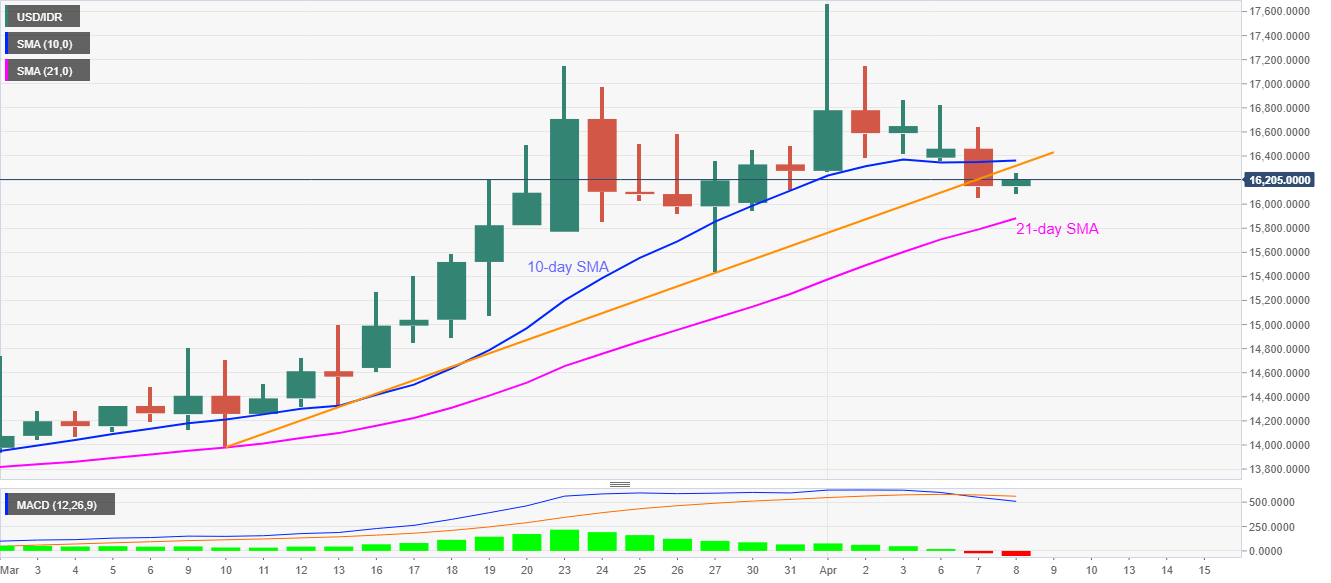
Following its drop to the lowest in a week, USD/IDR recovers 0.40% gains while taking the bids to 16,210 as the Asian markets open in full strength on Wednesday.
Even so, the pair stays below the one-month-old resistance line, previous support, as well as 10-day SMA. Also favoring the sellers could be the bearish signals from the MACD.
As a result, 16,000 round-figure and 21-day SMA level of 15,890 remain on the traders’ radar during the fresh selling.
In a case where prices slip below 21-day SMA, March 27 low surrounding 15,440 could return to the chart.
On the upside, the aforementioned trend line and 10-day SMA, respectively near 16,320 and 16,365, guards the pair’s immediate advances.
Also exerting downside pressure on the pair, beyond 16,365, will be 17,000 mark and March 23 top around 17,150.
USD/IDR daily chart
Trend: Further declines expected
