- USD/IDR struggles to extend the latest declines.
- Further declines can challenge monthly bottom whereas 13,705 holds the key to the month’s top.
USD/IDR stays modestly changed to 13,675 amid the initial trading hours on Wednesday. The quote recently broke the three-week-old rising trend line but stays above 21-day SMA.
However, bullish MACD pushes buyers to look for entry if prices take a U-turn beyond the support-turned-resistance line of 13,685.
In doing so, 13,705 could be their target ahead of challenging the monthly high near 13,760.
Meanwhile, pair’s further declines below 21-day SMA level of 13,665 could aim for the month’s low near 13,620 whereas 13,600 and 13,560 can please the bears afterward.
USD/IDR daily chart
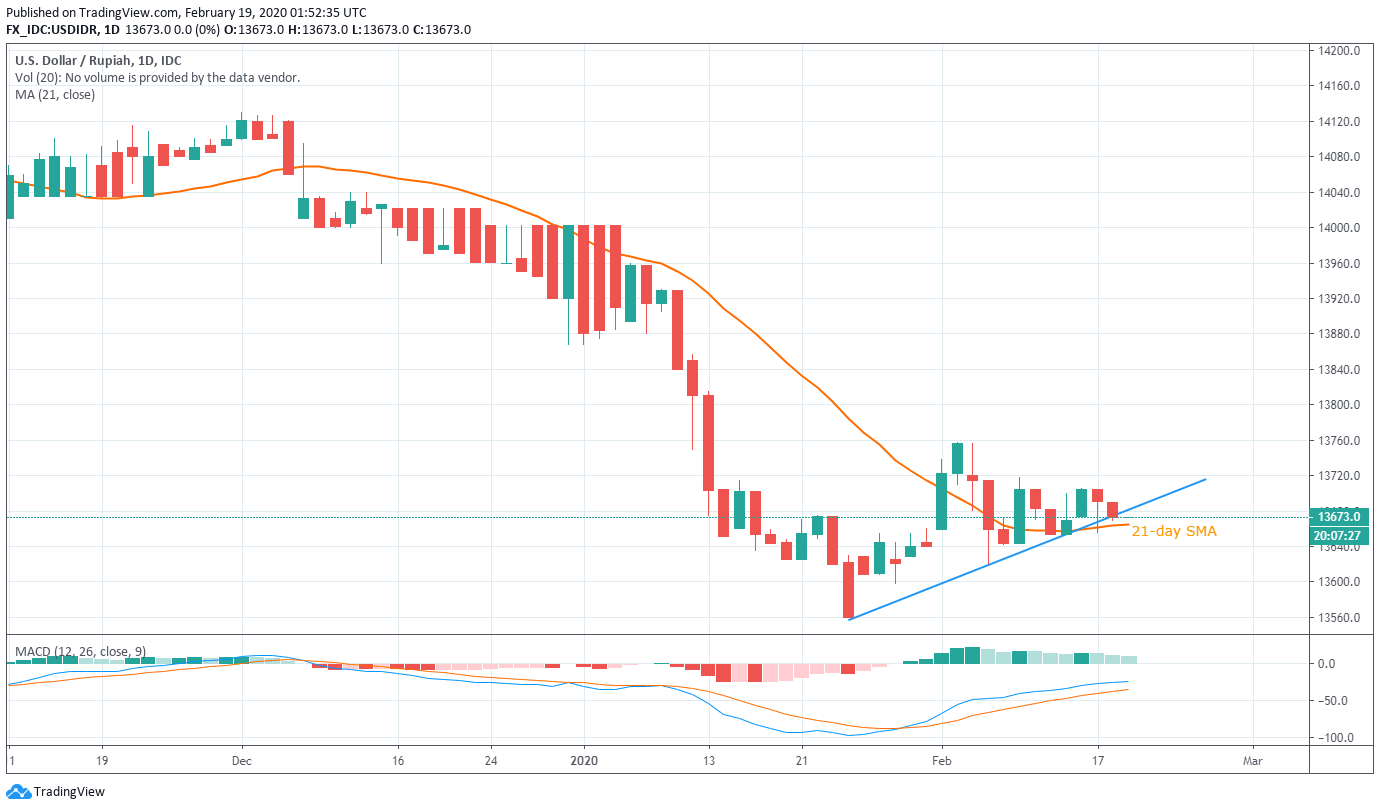
Trend: Pullback expected
