- USD/IDR remains positive around the 17-day top.
- 100-day SMA and a multi-month long descending resistance line add to the resistance.
- Multiple supports around 13,600 can entertain sellers during the pullback.
USD/IDR remains mildly bid around 13,740 amid the initial trading hours on Tuesday. Considering normal RSI conditions, coupled with the pair’s upbeat performance in the last three days, prices are likely to keep buyers hopeful.
In doing so, a downward sloping trend line since November 28, 2019, at 13,885 now, will become their immediate target.
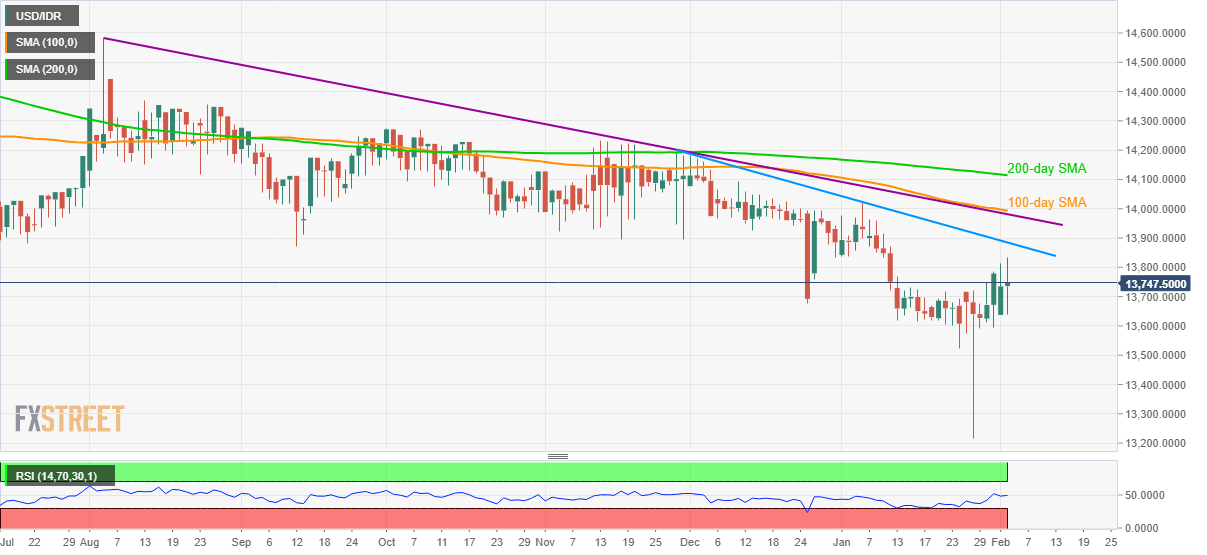
However, a confluence of 100-day SMA and a descending resistance line since early August 2019, around 13,980/95 area, could keep further upside guarded.
Should there be an additional run-up beyond 13,995, also clearing 14,000 mark, 200-day SMA around 14,115 will be on the bulls’ radars.
Meanwhile, multiple rest-points near 13,600 can question the bears ahead of offering them additional lag towards the south.
USD/IDR daily chart
Trend: Further recovery expected
