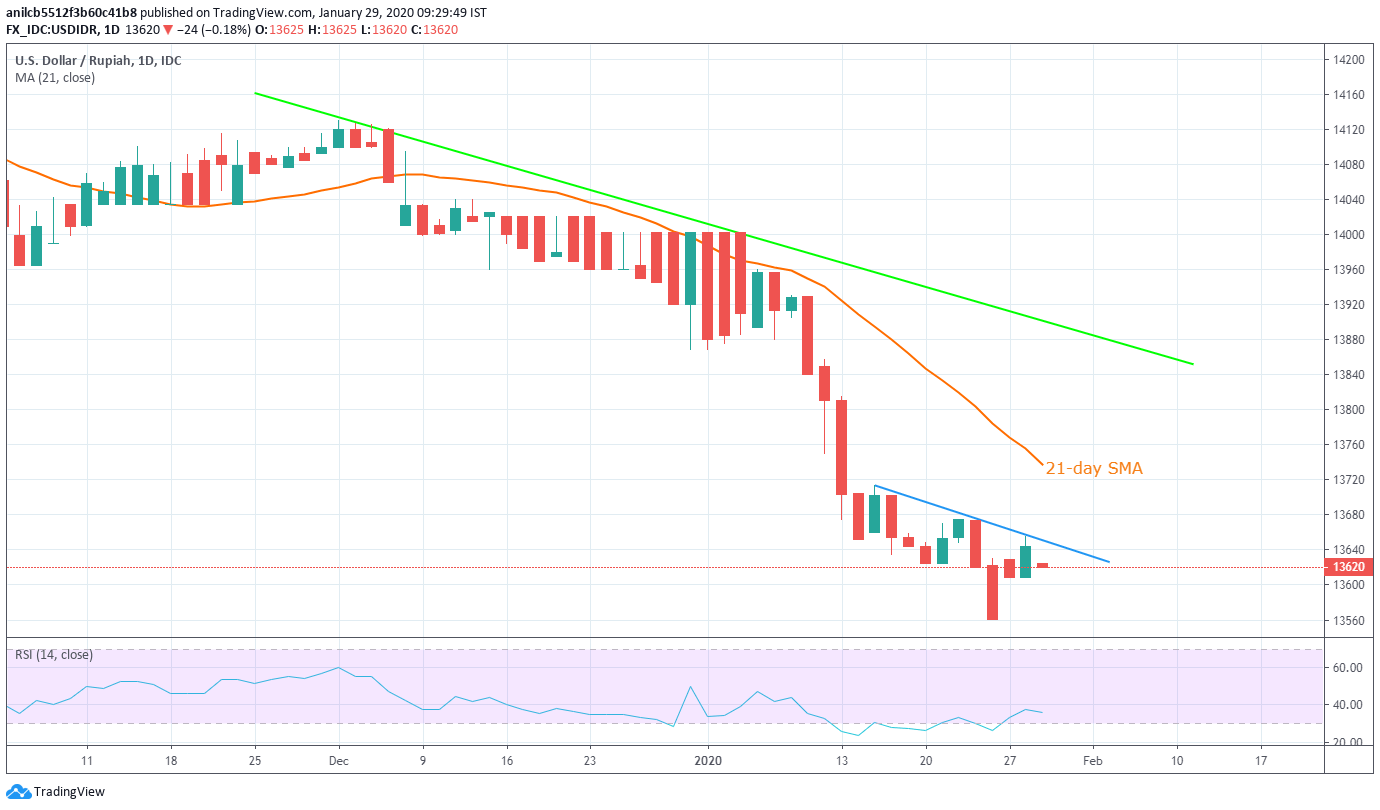
- USD/IDR fails to hold onto recovery gains from the multi-month low.
- Weak RSI levels can trigger another bounce.
- 21-day SMA, eight-week-long trend line add to the resistance.
USD/IDR takes rounds to 13,620 during early Wednesday. The pair recently bounced off the lowest since February 2018 but failed to cross the short-term resistance line, which in turn increases the odds of the pair’s further weakness.
While 13,600 and the recent low near 13,560 can please the bears during further declines, 13,450 and the year 2018 bottom close to 13,255 may mark their presence afterward.
On the upside, a clear break of 13,650, comprising the immediate resistance line, could push the USD/IDR prices towards a 21-day SMA level of 13,737.
However, pair’s further recovery past-13,737 needs to conquer a falling trend line since early-December, around 13,900 now, to lure the bulls.
USD/IDR daily chart
Trend: Bearish

