- USD/IDR drops after Indonesia’s trade numbers dropped in August.
- Indonesia’s Trade Balance grew past-$2.16 billion to $2.33 billion the previous month.
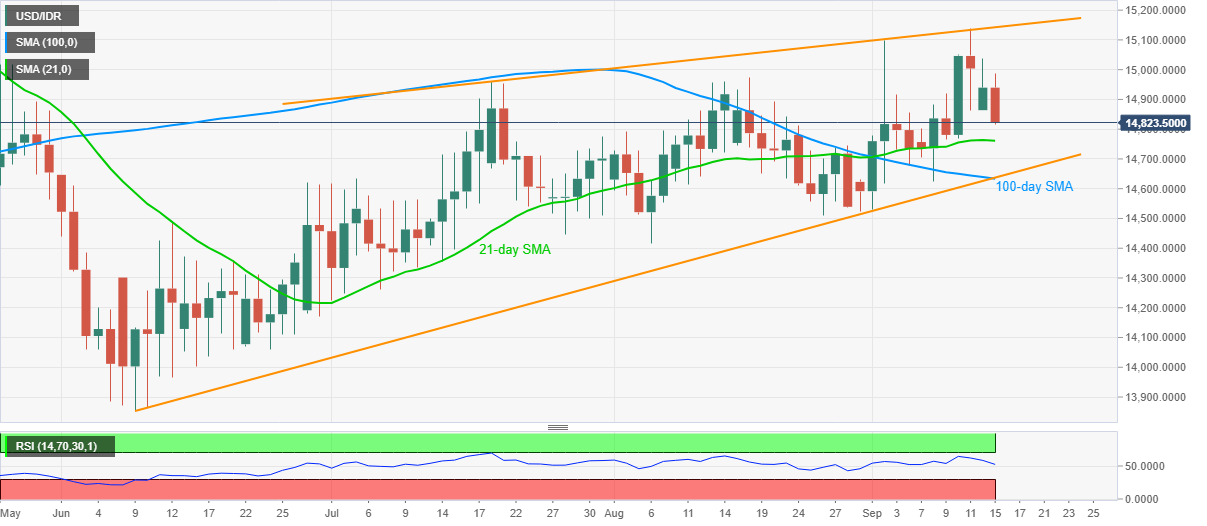
- A confluence of 100-day SMA, ascending trend line from early June offers strong support.
- A two-month-old rising trend line offers immediate key resistance.
USD/IDR stands on the slippery grounds near 14,825, down 0.77% on a day, during Tuesday’s Asian session. The pair’s recent drop can be traced to Indonesia’s August month trade numbers. In doing so, the quote defies the previous day’s upbeat performance while extending Friday’s U-turn from more than four month’s top.
Indonesian Exports dropped below -5.79% forecast to -8.36% whereas Imports recovered from -32.55% prior and -20.58% market consensus to -24.19% in the reported month. It should also be noted that the headline Trade Balance gained to $2.33B versus $2.16B expected and $3.26B prior.
The sellers are currently targeting 21-day SMA around 14,760 wherein the 14,800 threshold may offer an intermediate halt.
However, a joint of 100-day SMA and an ascending trend line from June 09, around 14,640/30, will question the bears then after.
On the contrary, the 15,000 psychological magnet offers adjacent resistance to the pair ahead of an upward sloping trend line from July 20, at 15,142 now.
USD/IDR daily chart
Trend: Further weakness expected
